Masterclass: How Luxury Consumers Behave Online

Max Leblond
Director of Marketing
Our Demographics API has long been popular among our customers, and it’s easy to see why. It gives robust information about the population anywhere in the US and Canada and is organized by categories, such as education level, household and individual income, population age, and more.
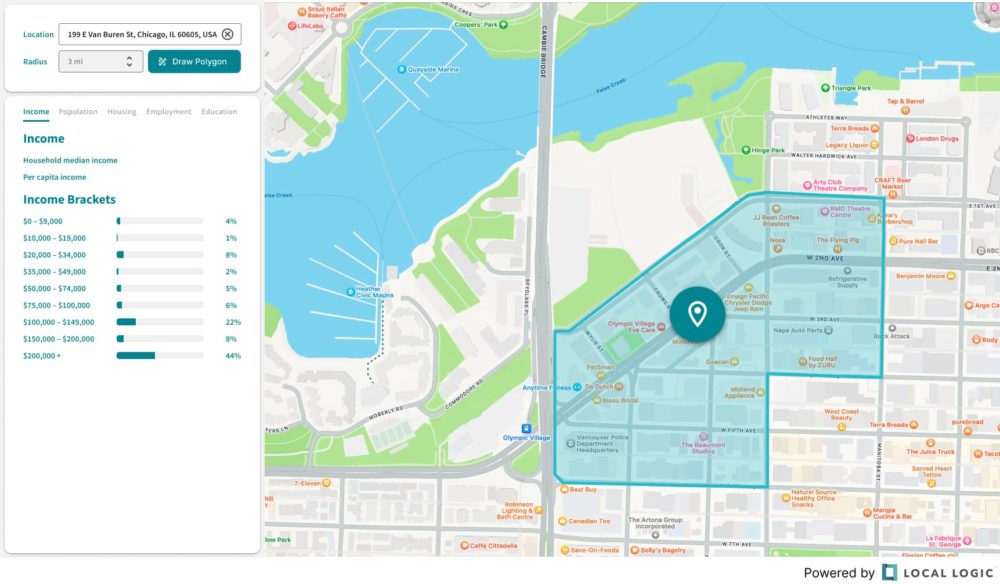
Today, we are thrilled to announce that we’ve increased the flexibility of the API to allow for custom-built polygons. This means you’ll now be able to define the area you want the data for with unprecedented precision.
Local Logic uses Canadian and US censuses to provide sociodemographic data at the street level. Our team uses the finest geographical granularity available to get the best precision.
As for demographic categories, here is a list of what we currently support:
At the resident level:
At the household level:
We also support family composition data.
Note that some of these categories are only available in Canada or the US. Please get in touch with our team if you have any questions or if you’d like to receive a data sample.
Our demographic data has historically covered a 500-meter radius or a walking distance of 5 minutes around a specific location – defined through a latitude/longitude combination.
But we’ve listened to your feedback, and today, we are super excited to announce that we have increased the flexibility of our Demographics API to allow for polygon queries.
This flexibility now allows you to define the area through your own polygon or a series of presets across all populated areas in the US and Canada.
You can learn more about the new spatial flexibility on our updated documentation or request a data sample.
This exciting new feature is the latest in a series of major product announcements that include:
And we’re only getting started! Sign up for our newsletter so you don’t miss our future announcements.
Request a free data sample today if you’d like to learn more about our Demographics API.
Max Leblond
August 10, 2022 | 3 minutes read