
How to grow your real estate business in 2024 with data-rich listing content

Thao Tram Ngo
Location, location, location.
We’ve all heard this old adage before. But what actually makes location so important in real estate valuation?
While 52% of an asset’s value may come from the property itself, the remaining (and equally as important) 48% is based on its surrounding location, which is often more difficult to quantify and understand objectively.
In our case study on how to price single-family rentals (SFR), Local Logic analyzed the different value drivers for determining property prices to understand the impact of location. As expected, location characteristics play a major role in the pricing of a home.
We analyzed large datasets that include property features, such as living area and year built, and location features, such as neighborhood vibrancy and proximity to schools, to identify what impacts property value in real estate.
Using a hierarchical modeling approach, we examined the relative importance of a property’s base features, city, and our own location data in explaining sale prices:
Local Logic compared the performance of these four linear regression models as measured with R2 on a test dataset. R2 represents how well the regression model explains the observed data that it has never seen before (i.e. data in the test set). For example, an R2 of 0.7 reveals that 70% of the variability observed in sales prices is explained by the model.
The graph below shows that Local Logic’s location data dramatically improves model performance when predicting sales prices. Combining all the data available (Base + City + Local Logic data) resulted in the best-performing model, even by only a small improvement over the Base + Local Logic model.
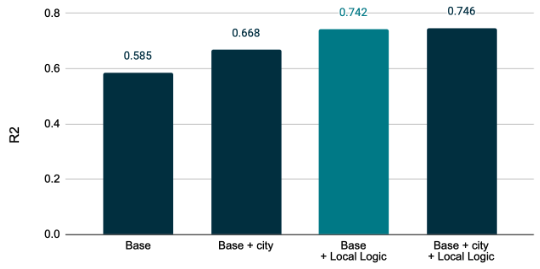
The graph compares the performance of 4 linear models using different data subsets. The model using both Base and Local Logic features explains 74% of the sale price, a 16 percentage point improvement over just Base features. While including City features also improves model performance over Base features, it does so to a lesser extent than Local Logic features.
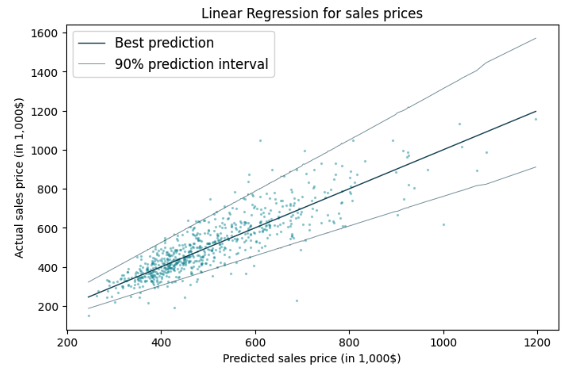
As shown in the scatter plot below, which visualizes model error on predictions versus ground truth, the model performs reasonably well in all price ranges. The model’s performance could be further improved with additional information about the assets, such as lot size, building quality, parking spot availability, recent renovations, etc.
Local Logic’s location data proved to be highly valuable in explaining the variance in properties’ sales prices.
Specifically, Local Logic data improves the explanatory power of sales prices by 16 percentage points compared to models that only include basic property features such as property size (square footage, number of bedrooms and bathrooms, number of floors) and other commonly used attributes such as building age and date sold.
Want to unlock your property’s full value?
Get a demo to learn how location insights can help you.
Thao Tram Ngo
March 21, 2023 | 3 minutes read