
Masterclass: How Luxury Consumers Behave Online

Max Leblond
Director of Marketing
Commercial
Local Analytics
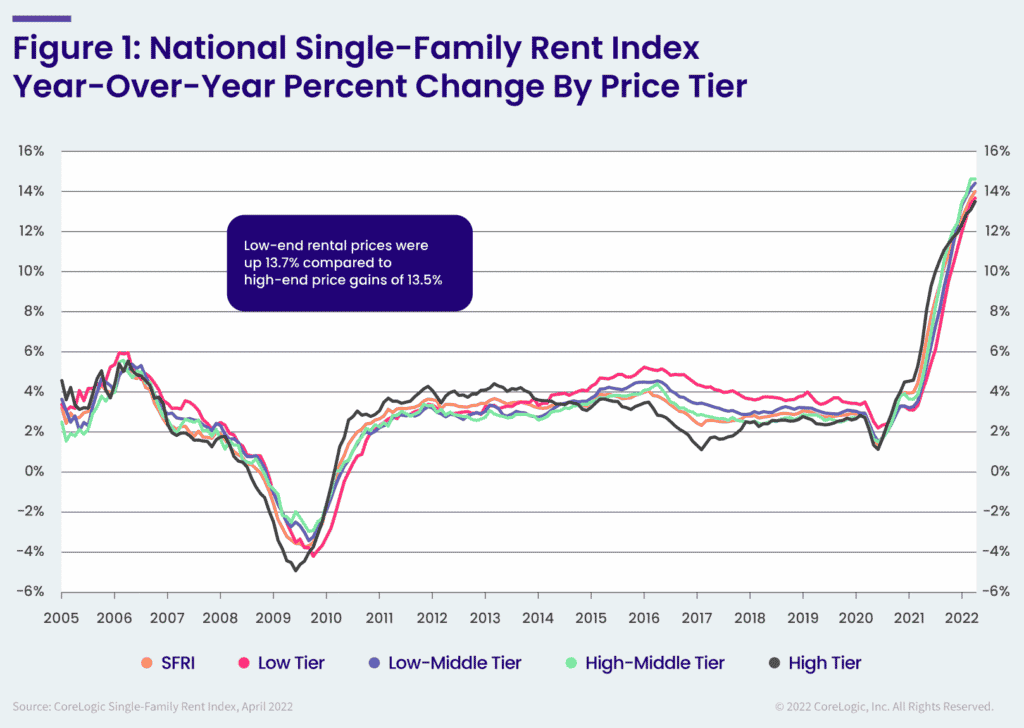
It’s hard to talk about real estate investment today without landing on the topic of single-family rental (SFR). SFR is hardly a new phenomenon, but it has seen explosive growth in recent years. Occupancy in Q4 2021 was near 95%.
According to CoreLogic’s Single-Family Rent Index, SFR has seen 13 consecutive months of record-breaking year-over-year rent growth for all price tiers (see chart below). In April 2022, the year-over-year SFR rent price growth was more than double what it was one year prior and more than six times higher than what it was two years prior.
Unsurprisingly, investors have been piling in. Nowhere is that more noticeable than in the growth of institutional investors in SFR. Data from Finsight shows that issuances for commercial mortgage-backed securities (CMBS) in SFR more than doubled in 2020, nearly doubled again in 2021, and are on track to outpace the 2021 figure in 2022.
For SFR investors, these are exciting times! But the increasing competition for deals also creates new challenges, including how to discover opportunity-rich neighborhoods that other investors are ignoring. Most investors already have access to the same information about new homes coming on the market for sale.
But what about opportunities hidden in neighborhoods that are similar to high-demand neighborhoods but that, for some reason, haven’t seen a spike in SFR investment? Most investors would jump at the opportunity to identify these hidden gems, yet in most cases, they lack granular street- and neighborhood-level insights needed to make robust discovery possible.
At Local Logic, we’re building products that help investors quantify street- and neighborhood-level insights so they can precisely identify these kinds of opportunities and avoid critical risks. Below, we show how investors can use our granular insights to overcome the challenge of discovering promising neighborhoods that aren’t on most other investors’ radar.
Today, Phoenix is a top destination for residential real estate investment. In the broader Phoenix metro area, the neighborhood of Arrowhead Ranch in Glendale stands out as one that has seen strong SFR activity in recent years. On the one hand, SFR homeseekers like the neighborhood. On the other hand, investors are sufficiently aware of the neighborhood’s attractiveness to make competition for deals a challenge.
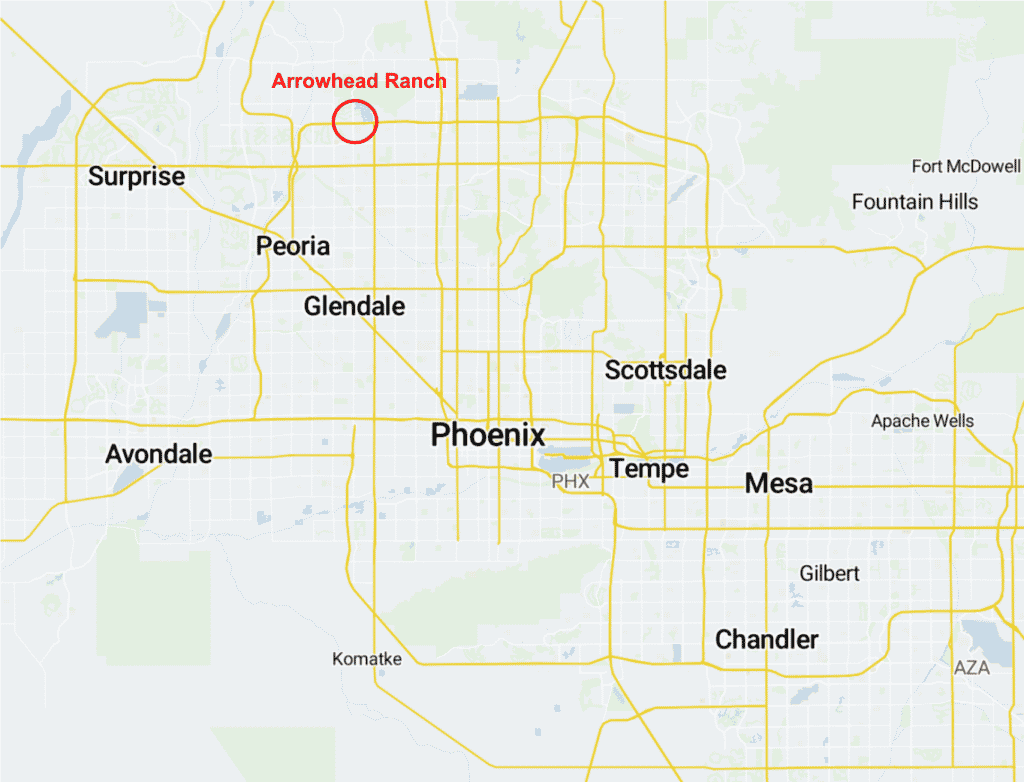
Arrowhead Ranch would be an excellent place to invest if it weren’t for the already strong presence of other investors. Where can we find neighborhoods similar to Arrowhead Ranch and, therefore, likely to elicit similarly strong demand from SFR homeseekers?
Before we can discover similar neighborhoods, we first need to select the variables we will use to measure similarity. Local Logic has hundreds of location insights at the site, street, and neighborhood levels, so there’s a lot of room to analyze which variables best predict success and to iterate over time. For the analysis below, we chose a small number of variables that often show up in SFR buy boxes. They are:
Scoring each neighborhood in the Phoenix metro area on each of the listed dimensions produces a dataset that we can use for subsequent steps in the analysis.
With rows in the dataset created above as inputs, we use a k-nearest neighbor algorithm to measure neighborhood similarity. We could use this to identify the similarity (or difference) between any pair of neighborhoods in the metro area. For this analysis, we focus on similarity with our point of reference neighborhood, Arrowhead Ranch.
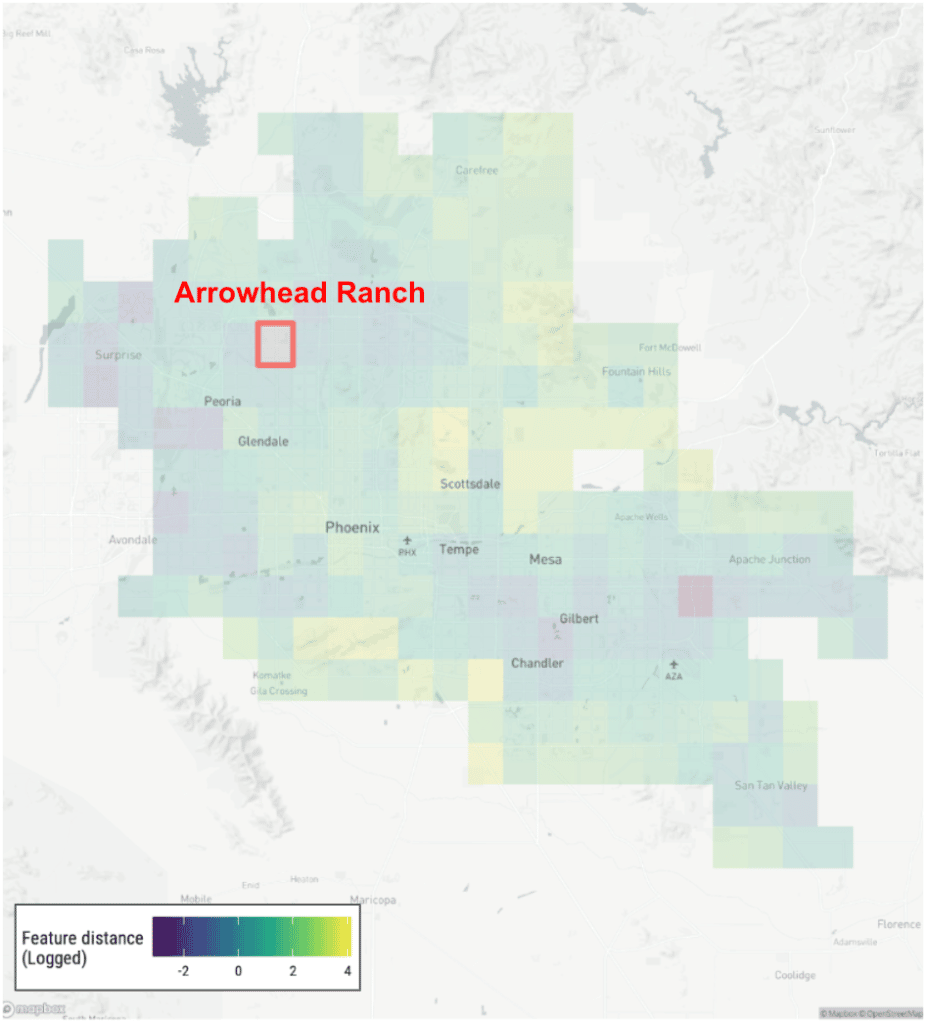
Figure 3 below shows the output of this process. In the visual, individual neighborhoods are colored according to their similarity to (logged feature distance from) Arrowhead Ranch. Dark purple indicates extreme similarity, while bright yellow indicates extreme distance. Glancing at the map, we can see that few neighborhoods sit at either extreme, but a good amount of variation still exists to identify promising alternative neighborhoods.
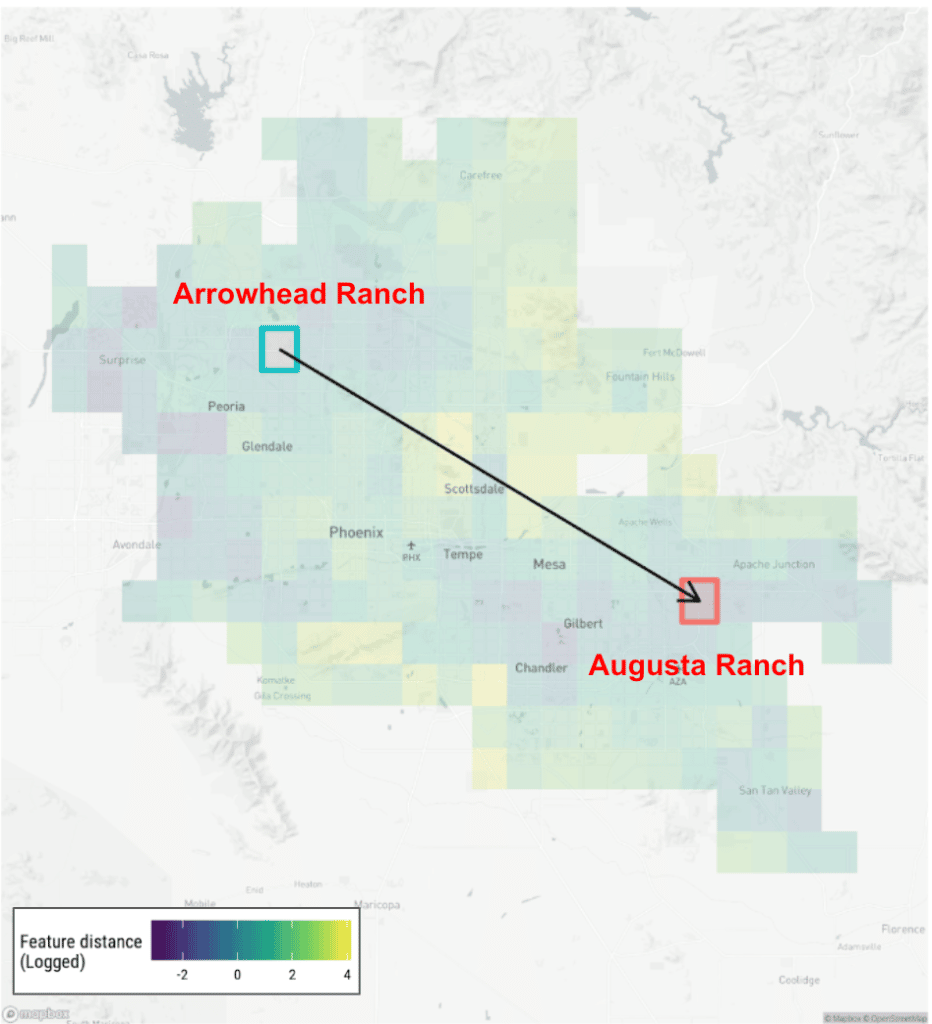
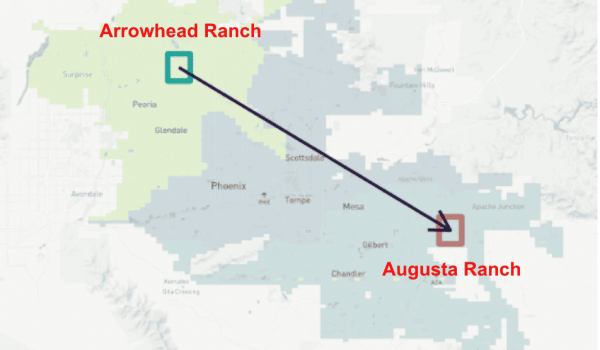
To identify the most promising alternative neighborhood, we first rank neighborhoods by their similarity to Arrowhead Ranch. Of the contenders, Augusta Ranch stands out as the most similar neighborhood. Figure 4 below shows that Augusta Ranch is some 42 miles from Arrowhead Ranch. Yet, our granular location insights show that it is very similar on the dimensions selected as key for investment and for eliciting homeseeker demand.
Pulling back the cover to see how individual neighborhoods score on a few key dimensions listed above helps understand why Augusta Ranch ranks as most similar to Arrowhead Ranch. Figure 5 provides heat maps for proximity to grocery stores, interstate access points, and high-quality schools. Dark purple indicates poorer proximity, while bright yellow indicates greater proximity.
We can see that for any of these (or other) dimensions, Arrowhead Ranch is similar to many neighborhoods in the metro area. When combining the dimensions listed above, Augusta Ranch stands out as very similar.
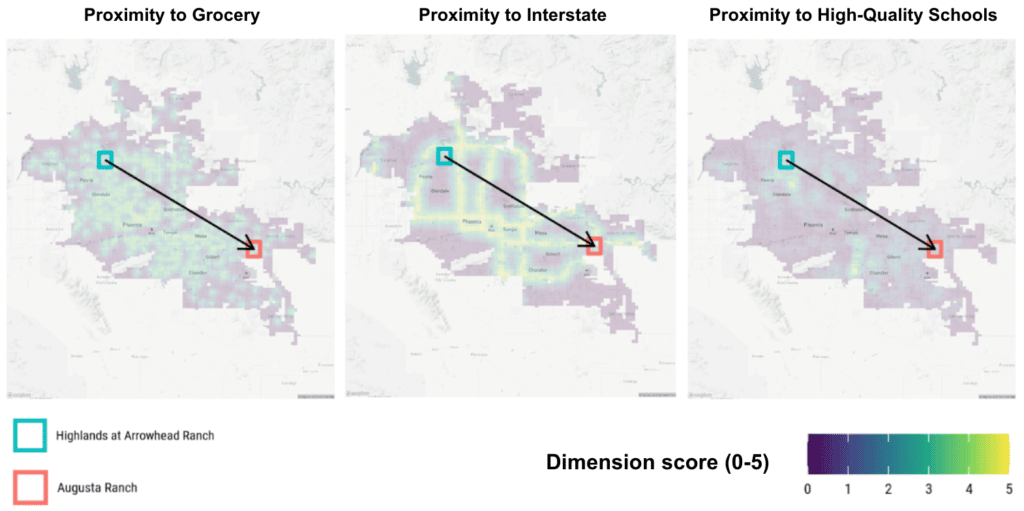
Augusta Ranch is slightly further from downtown Phoenix than Arrowhead Ranch, yet it is close to several satellite towns that are themselves commercial and employment centers, including Mesa, Tempe, Scottsdale, Gilbert, and Chandler. That bodes well for homeseekers seeing it as a residential neighborhood with fairly quick and easy access to employment hubs, retail centers, services, and so on.
Separately, examining the number of SFR units currently on the market in the two neighborhoods suggests that Augusta Ranch has lower market activity. That is promising for investors looking for neighborhoods that are similar in character to our point of reference but that are not faced with as much competition for deals.
Risk analysis is something most investors do regularly, but not all risks are treated as importantly as they should be. Physical climate risks – those risks stemming from the physical effects of climate change (e.g., drought, flood, storm, heat) – were ignored for a long time because the effects were not large enough to matter for investments in most places in the US. That is no longer the case as physical risks grow in more and more locations.
One recent example of this was the National Oceanic and Atmospheric Administration’s forecast that 2022 would see, for the seventh consecutive year, above-average hurricane activity in the Atlantic region, which includes the Gulf of Mexico, Caribbean Sea, and North Atlantic Ocean.
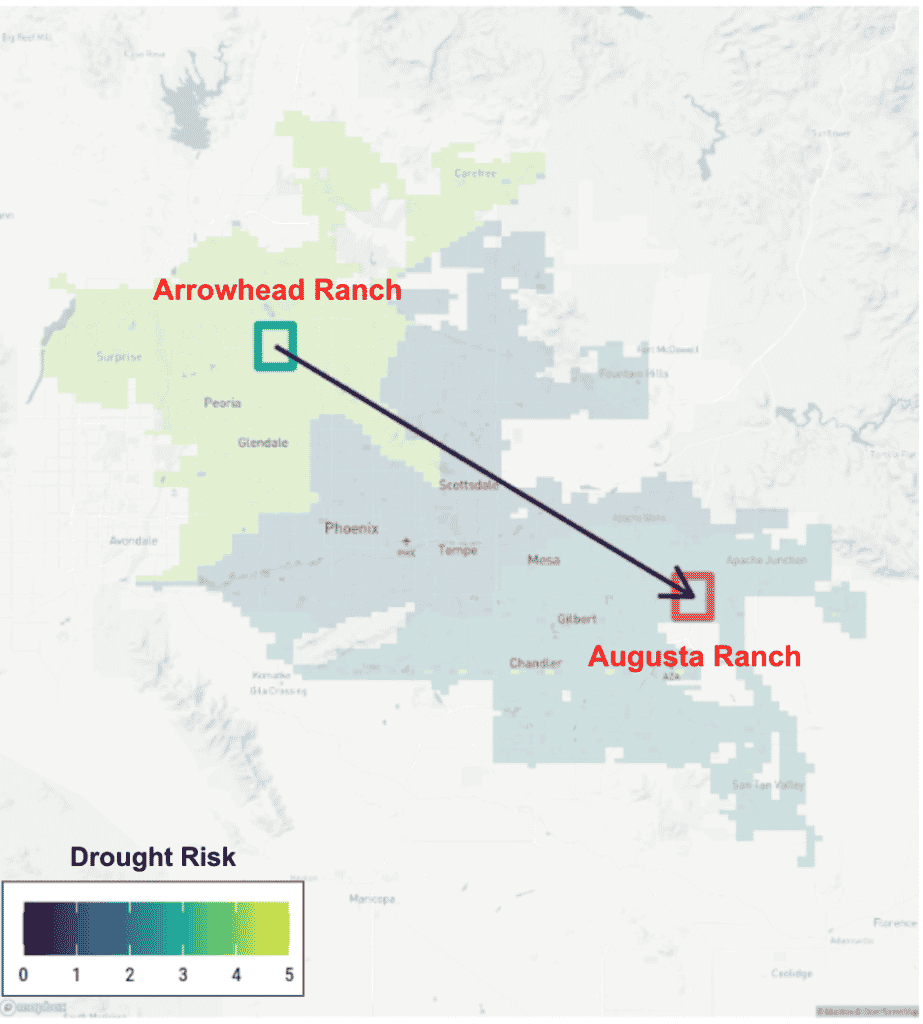
According to ClimateCheck, Arizona ranks as the riskiest state in the country when it comes to drought. In general, the Phoenix region faces lower drought risk than some other cities in the state, notably Yuma and Casa Grande. But even within a single metro region, it’s important to drill down because different neighborhoods face different levels of risk.
Figure 6 below plots granular ClimateCheck drought risk data for neighborhoods throughout the Phoenix metro area. Deep purple indicates low drought risk, while bright yellow indicates high risk. As you can see, Arrowhead Ranch faces much higher drought risk than Augusta Ranch. This is one more reason that makes Augusta Ranch a location with solid investment potential compared to many other areas in the metro region.
Markets are filled with untapped opportunities. They’re also filled with risks. Succeeding means finding ways to understand these opportunities and risks better than competitors.
The hundreds of location insights that we are building help investors understand granular site, street, and neighborhood-level attributes are crucial in identifying and measuring these opportunities and risks. This is true for SFR, as we showed in the market discovery analysis above. But it’s just as true for multi-family, for-sale residential, office, retail, public sector services, and other areas.
Customers are already using our granular location insights throughout the US and Canada to assess incoming deals, measure risk for new and existing properties, and uncover hidden opportunities.
Locations are complex ecosystems that evolve over time – sometimes very quickly. Any given site might be close to key services, employment hubs, high-quality schools, and vibrant clusters of restaurants and shops. It might face growing physical climate risk. It might be exposed to indirect climate risk as a result of its dependence on port or rail or road infrastructure that itself faces direct physical risks. Or it might not.
Every site has its own set of specific attributes, each of which can be measured and monitored – if you have access to the location insights to make that possible.
Reach out to our team to find out how our location insights can help you improve your own investment analysis, risk assessment, and market discovery.
 Book a demo

Colin Stewart
July 11, 2022 | 9 minutes read