How Top Real Estate Leaders Thrive Amid Disruption
Industry
| 18 Jun 2025
Last week, Local Logic’s Head of Corporate Strategy and Business Development Sara Maffey joined James Blackwood, VP of Customer Care & CRO at Giraffe for a masterclass on strategies and tactics the industry can leverage to gain a competitive advantage today.
For 30 minutes, they discussed how to:
Sara Maffey (SM), Local Logic:
I am Sara Maffey, the Head of Corporate Strategy and Business Development at Local Logic. Welcome to our masterclass! We’ve been doing a series of these. Today’s will focus on conducting robust site analysis with demographic data. And we’re going to throw in some other location data into the conversation as well.
Today, I’m joined by James Blackwood. He’s the Vice President of Customer Care at Giraffe.
Local Logic is a location intelligence provider and we’re quantifying location at scale to shape smarter development and more sustainable cities throughout the U.S. and Canada. Before I joined Local Logic, I worked in commercial real estate, so that comes out in some of the comments that I’ll be making.
So, James, maybe you could just introduce yourself and Giraffe to our attendees. Let us know what kinds of data and insights you provide and what sets Giraffe apart.
James Blackwood (JB), Giraffe:
My name is James. My background is in data and analytics, and I joined the founders of Giraffe who are architects, engineers, and urban planners, right at the inception stage. I’ve enjoyed watching Giraffe grow from a small idea into an urban analytics platform, which is how we brand ourselves. Whether you are a city planner, an urban designer, a property developer, or anyone in the capital allocation process, Giraffe is a place for you to collaborate with your team and understand how to deploy that capital.
At its heart, Giraffe is a giant drawing pad on a map with a calculator for a brain. But behind the scenes, it’s a suite of APIs that allow us to connect to market data to inform your capital decisions — whether that’s later in the stage or early in the site selection stage. We’re having this discussion where we can create connections with subject matter experts and visualize data on a map.
And that’s what is very exciting to us about this conversation; having your data in our platform means our users are a lot more educated while they’re in that process of trying to figure out where to deploy their capital.
SM:
We’re going to show some live examples of that in a moment, specifically our demographic data. But Local Logic has a lot more than demographic data. I like to think of us as the data version of boots on the grounds because we’ve quantified everything outside the four walls of that regardless of what that asset is throughout the U.S. and Canada.
You’re telling the story with all these different data points about the human experience of place. We get down to the granular lat long level, and then we can go with different geographies above that for context and to look at market-level insights.
So, we also have a suite of APIs. We’re going to talk about one of them, in particular, that’s been implemented by Giraffe. We have our data also available via CSV. We’ve got a suite of web tools that have a major market share in home search sites throughout the U.S. and Canada. We’ve got a platform which I’ll be showing you in a little bit. And we’re also doing quite a bit of data science as a service right now to help our clients get started in understanding which of those location insights to use in their portfolio analysis and asset management.
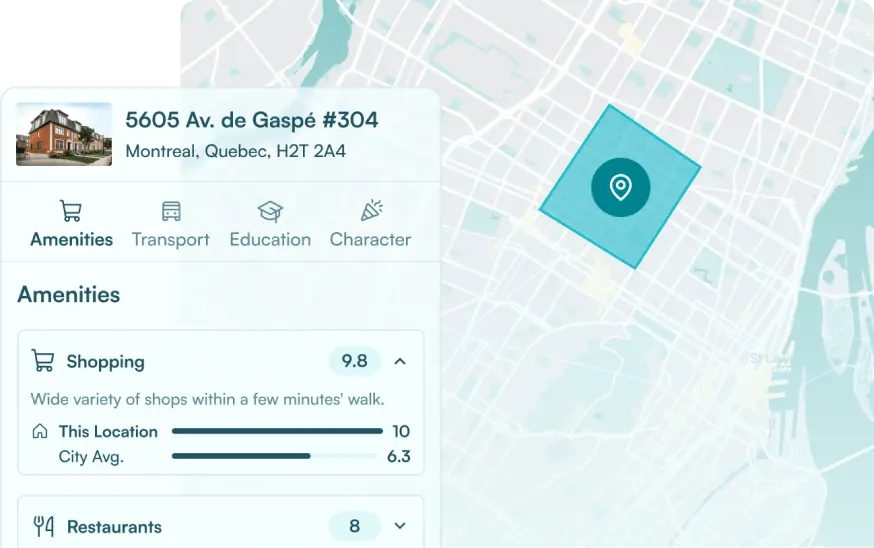
Our location insights cover a variety of things like walkability, rapid transit, bike friendliness, car friendliness, and access to amenities like schools, restaurants, and retail. Then we get into things that you might think of as being more subjective, but we’re using data to quantify them, like quiet levels, vibrancy, and wellness.
Depending on which asset class you’re working with or what kind of market you’re in, it might be a variety of those different pieces put together in that investment thesis that you’re looking for. So, James, as we’ve talked about previously, there are some great synergies in how we think about cities and urban planning and development.
To level set, Local Logic has recently had our Demographics API implemented on Giraffe’s platform. And we’re going to give you a sneak peek at what this looks like and maybe tell you a little bit more about what’s going on in the genesis of this partnership.
JB
Yeah, perfect setup. And we like to think of Giraffe as that single pane of glass that our customers look through when they’re thinking about, particularly ground-up development, but any investments in a real estate market. To have all of that macro-level data that you’re describing in Giraffe at some point is going to be an absolute mecca for our clients.
And the real driver for this discussion is one of our key partnerships with the Trammell Crow Company. We’ve been talking with them about what would help them enhance the way that they’re looking at their sites across their whole business and who are the people in these markets. They have lots of processes to identify markets that they’re operating in and the kinds of products they want to deploy in those markets.
But that right now happens across lots and lots of different systems whether it’s bespoke tools that they have built themselves or tools that they’re buying off the shelf. The beautiful thing about the API economy, which both of us are playing in, is that with a tool like Giraffe that is spatial in its nature, you can bring in all these datasets to inform those decisions.
The user only has one place as they’re thinking about how they are deploying capital across their portfolio. Then, they can be informed. They don’t have to jump around a lot of different systems, aggregate them on a slide deck, or pitch them to somebody. It’s all happening there at their fingertips. So I thought I’d show something to our customers who were doing that kind of portfolio work, and then get down to the building level of evaluating a concept.
We could start by having a look at how we’ve made this first step work together perfectly. So, what we’re looking at right now is Giraffe. This is our platform. We’re in Atlanta. What I’d like to say about Giraffe is that it’s a digital twin of the whole world, but it’s also a digital twin of your internal business processes.
As you learn and develop a process around how you want to conduct your due diligence, Giraffe is adaptable and customizable to your organization. When we look at our portfolio in Atlanta, we’ve got lots of different sites that we’ve investigated. I can dive into some of those at a later point, but we want to start looking at different sites.
We have another great partnership with a fantastic company that had parcels for every location in the US, or every parcel in the U.S. and the ownership data of those parcels. But as Sara was saying, parcels are the assets, but the metrics around that asset are the things that define its value.
And then obviously what we put on that asset as well. So, if we look at this particular site down here, it’s a Zone C4 and it’s owned by this particular owner. Let’s dive into that site. I’m just going to create a new project which defines a boundary based on the parcel. As I do that, I have the option to track my process if I would like to leave some notes on the site.
JM
This is where we start getting really interesting. The first step we’ve made in the partnership with Local Logic is to bring in that demographic API that Sara was talking about. And we do that through what we call an app. It’s a custom code that we’ve deployed inside the Giraffe platform that links to APIs and displays the data based on the spatial information that we’re parsing.
In this case, when you have very clean, beautiful APIs, like the ones Local Logic built, building that into Giraffe was a very pain-free process and something that was high value for a lot of our customers. As I open up the parcel, I’ve got the Local Logic app open on the right-hand side at the ready and it’s parsing in that boundary through to the Local Logic API, which is then returning two things.
One is this polygon that’s defining the boundary of the five-minute walkable radius from the site. I can then change that to a manual radius. If I want to say, “Show me everything within a mile of the site,” you can see the radius expand significantly. But importantly, it’s returning all the metrics of the people that are working and living in this neighborhood.
Sara, I don’t know if you want to go further into the data here, but being able to visualize it quickly like that is super high value for our clients who are doing the due diligence and presenting this to potential investors in a site.
SM
Yeah, I think I think the other piece of it is just that customizable radius. That’s something we get feedback on all the time. The five-minute walk goes back to our urban planning, nerdy roots, That’s a really accessible walk and a very actionable way of thinking about demographics. I love the way that you guys have implemented this — it’s so beautiful.
JM
It’s awesome. It’s a testament to your APIs and our SDK, which any of our clients (who are on an enterprise level) can use to build bespoke experiences. Your data is extremely powerful at this level.
SM
Of course, getting into the demographics is the individual piece of this. A lot of different forms of collateral are going to call for this kind of data. It’s really convenient to be able to switch and toggle between these different radii or whatever it is that you need to be included in the collateral.
We’re going to get into maybe some examples of how this is being used, from the multifamily side.
JM
Exactly. It informs a number of different asset classes or building types that we may put on a site like this. Everything that we do here in Giraffe can be boxed up and put in a report that we then pass off to the investment committee. A lot of our clients still love to put things in slide decks, so they’ll screenshot and put it together that way.
JM
Maybe what I’ll do is program a site right now and kick some of this data into a feasibility model that shows that macro story and how that sums up to a portfolio level.
Local Logic is everything outside of the site, which you guys say is 48% of the value of the site. How the site is entitled and ultimately programmed is the remaining factor of that asset value and that’s where Giraffe really excels.
This is probably a crazy site that I’ve chosen to develop on. Looks like it’s some walk-up apartments that we could look at and maybe we are going to restyle into something of much higher density.
As we do that, when we’re looking at sites like this, there are a lot more constraints that we can find on a site other than just the macroeconomic movements. Giraffe is a platform that can work nicely with GIS. I can go and bring in contours. This is coming from the US Geological Survey’s website or their GIS system. We can bring in the Fish and Wildlife Wetlands Data.
These are national data sources that are free to use. As we were saying earlier, they are distributed across lots of different systems which makes the pattern we’d like to work with. So we’ve aggregated those together. Then as we start to look at this site, we can now deploy some programming.
Everything we do with Giraffe is fast, and flexible, but it relies on you knowing what you’re doing to get some value out of it. We’re not one of these tools that are going to tell you what to do. We’re more like a sharp pen or a sharp sword for an expert to come in and get value very quickly.
Let’s say we were going to do something more high-density here. I’m going to turn off the 3D buildings and we’re going to do something like a Texas donut-style multifamily thing.
What I’m going to do is start with parking, draw it up here on the top left — we’ll say it’s something like 200 by 150. As I lay that down, you’ll see on the right-hand side, I’ve got all this really meaningful data about what I’m programming the site with. Everything in Giraffe is always 2D and 3D.
Let’s pop this up to a few more levels. I’ve got some number of arrangements that are being spit out here for about 400 parts. Everything in the USA is bigger. So let’s make that base slightly bigger and the road slightly bigger. And then let’s wrap this with a resi wrap construction. So, I’m going to do that residential, draw with a line, and then I’m just going to snap to the different corners.
As we do that, I’ve now got a multifamily building — just way too high. So, let’s drop that down. That’s four levels in a Texas donut-style arrangement. I can see over here all of the data that’s coming from what we’ve just designed. When you do a quick site study like that, being able to quickly measure what we’ve thrown down on the site is very helpful. But that is sort of a bit useless if you can’t then tweak the assumptions that ultimately result in yield.
And that’s where these two data sets and ultimately some of the other data sets that you have that we want to get our hands on can start to interplay together. We can take outputs from market data that you have, like comparable rents or Location Scores for instance, and start to build in factors and bake them into our financial model. As we are trying to project a return, we’re seeing that it’s much more data0driven than just knowing that we can build it for a few bucks per square foot and rent it for 25% or whatever it might be.
SM
Yeah, absolutely. Might be a good time maybe to show some of those different layers that we could add in.
JM
I would love to hear a little more about that additional data that you have because I think what we’re excited about is really the start. It’s not the endpoint. We’re starting a long-term relationship here. So let’s go down that path.
SM
So, this is Local Logic’s platform, and I think it’s just a good way of visualizing some of that data that we’d love to see baked into Giraffe in addition to the demographic data. We can add some of that in, and I’ll just show you an example.
We’ll look at household income of at least 90,000, and you can start to see that heat map. The darker the green, the more it matches, while the darker the pink, the less it matches whatever we’re putting in the investment thesis.
And then some of those other location characteristics, so the scores that you mentioned, James. We’ve got walkability, for example. It’s looking at the actual accessibility of day-to-day needs around the site and how pleasant that walk is.
Here you can see that visualization on top of the demographic information. We can also add in something like vibrancy, for example, and we’re showing this all on a scale of one to ten. We can also change importance.
People use our platform to take screenshots to include in things as well. We’re both looking at Atlanta here. So you can start to see the places that match this investment thesis that we put in. I like to add in rapid transit, especially in Atlanta where we’ve got a little bit of a spine going down in the center of the city. You can take this heat map anywhere in the US and Canada once you’ve got this investment thesis styled in.
The thing I was thinking of as you were speaking about building the model is starting from a place of that portfolio analysis where you run those analytics on all of the different data points that we have, the performance of the assets in the portfolio. You start to see, when I’m looking at a new market, for example, what types of things should I be dialing in here.
Maybe I see in that model really high vibrancy, great walkability, access to transit, certain income levels, and certain population age or density. Maybe it’s grocery stores or schools, depending on what I’m building.
You can start to be very targeted with what you’re looking for. And it’s not just your gut feel of the kind of areas you’re looking for. It’s actually data-driven based on the performance of your own portfolio. As I just pulled up over here, you can start to see location scores at the lat long level. This is really specific to this site.
If you click in, you can also start to see the city and the neighborhood level again in the API. There’s a lot more flexibility. We’ve also got points of interest that are categorized. We have this type of data layered into what your app has.
JM
For multifamily, understanding those trends is critical. You can’t do it without it. Part of my role is to be deeply embedded with our customer base. And I’ve spoken to probably at least hundreds, maybe thousands, of developers whose processes are awesome, but they’re also very, very manual.
One guy I spoke to said, “Every time I look at a site, I drive around and look at what cars are parked in the driveway to understand if the area has money.” I was like, oh, that works. Or, you could buy a Local Logic subscription and not have to get in your car.
It is funny to see as this industry is changing how good data is. There’s lots of data out there, but there’s not a lot of good data out there. What we like about this partnership is that your data is really good. It has a deep methodology rooted in deep expertise, which is in line with where we’ve come from and what we’re trying to do. Very excited about the long-term potential.
You can think about these site searching criteria where you’ve got the parcels there in front of you, bringing in your point of interest data and your location scores, and all of a sudden you’ve got a really powerful site searching tool that can crawl through areas quite quickly.
SM
I love it because it’s like the two sides of that process. What we often answer is what market should I even be looking in? Before you even get down to the site level, where should I even be looking? Draw me that X that marks the spot or that circle, and then dial in from there.
We can help with that, but also on the site-specific side where you guys can really dive in as you were showing us. Is there anything quickly that you want to show?
JM
I’ll show one more thing. For those who are familiar with the Atlanta market — this is a bit of a sneak peek at something that hopefully will go live. Either today or later this week, depending on a few behind-the-scene things.
With Giraffe, you’re looking at a site in its individual contained parameters. Some of our customers are seeing 10x order of magnitude improvement in pursuing deals.
But the power of Giraffe is once you sum those things together in a portfolio. I want to show you a partnership that we’ve had in the works for a little bit that is being released. Because some of the things that drive the market are obviously what’s there today, what can we score today, which is where you guys play best in market.
But then there is this ‘what’s coming’ piece to a market, and that has been notoriously very difficult. If you talk to a lot of developers, what do you look at every day? They often are looking at news sites and development news sites in particular. And for those who are familiar with Urbanize, a publication with a great rap in Atlanta and a few other markets, they spend a lot of time tracking developments in their area.
So, we have a partnership with Urbanize, which is taking this to market in the next few days, to visualize in Giraffe every building that’s being proposed, under construction, approved, or completed in the Atlanta metro. That means that as you’re looking at deploying capital, you can withdraw if you’ve got a picture of what is the asset and where is the asset. With Local Logic, you’ve got all of the data that surrounds the macroeconomic climate in that area.
Then you’ve also got a picture of the future supply that’s coming into that market. So if you’re thinking about building a multifamily asset, you want to make sure that you’re not building in an area that’s going to be just totally saturated with empty vacant apartments. This data is all scraped and put together by Urbanize.
Quick example — if I dive into the Centennial Yards project, I can see not just the stage and status of the project, but the massing as well. If this apartment’s there, it’s forecasting that too.
SM
Yeah, I love that project as an Atlantan. With the couple of minutes we have left, high-level, what’s on our roadmaps? I’ll go first because I think you’re thinking about looking into the future. One of the things on our roadmap is starting to make available our historic insights of how location has changed, which is a big part of understanding what could be coming in the future and diving into that data-science driven portfolio analysis with our clients.
We have hundreds of insights at every lat long in the U.S. and Canada, and some of them will drive performance more than others, depending on what you’re doing. So that’s a great way to get started with us, and figure out what combo of those things you need to use in the future to make data-driven, more efficient decisions.
How about you, James? What else is what else is coming?
JM
We have a very big evolution of our product coming up toward the end of the year. We have a few data partnerships coming down the pipeline. Some reinvigoration of existing data partnerships that we have. Some cool new tools that are centered around design. Some cool new tools that are centered around the interrogation of spatial data. And some other secret things too, that I can’t share, but maybe coming.
SM
All right. We have one minute left how do our attendees learn more about each of us?
JM
You can email me james@giraffe.build. I always love to talk to anybody that wants to talk to us, but our website giraffe.build is generally the best spot to find information.
SM
My email is sara@locallogic.co, but locallogic.co is the best place to find information. And we’ve also got a bunch of events happening this Fall. A lot of us will be at the SFR West Conference in December, for example. So it’d be great to see people in person too if you’re going to be at that.
If anybody has any questions, now’s your chance.
JM
Giraffe is free to try. In fact, it’s free forever for one project to live. So if you want to go and become a Giraffe customer, you get one project and you can have it forever. If you want to get, Local Logic data or any of the other things I showed then you have to become a customer.
But we love doing free trials, so please reach out. And we typically start around $3,000 a user a year for a Giraffe platform. But it’s different if you’re an enterprise customer or if you want to buy data, etc.
SM
We have so many different solutions depending on the scale you’re looking at, if you need a platform, or if you need APIs. So please just feel free to send me an email or go to locallogic.co and we can figure out exactly what you need.
I just want to again thank everybody for joining us and letting us show you this kind of deep dive into what our platforms look like and how this demographic and other location data looks like visualized in such a powerful, actionable way. Thanks for joining us, James. And thanks, everybody for tuning in. We’ll have some more masterclasses coming to you and we’ll see you soon.