Oakley Signs Joins Forces with Local Logic to Bridge the Gap Between Physical Signage and Digital Insights
Partnerships
| 12 Nov 2025

Where you live shapes which transportation modes you’ll use, what kinds of people you’ll befriend, what ideas you’ll be exposed to. Where you set up your store determines who’ll shop there, what kind of clients you’ll attract, how much money you’ll make. Where you build a new transit station impacts how many people will use it, how the land around it will develop, how nearby transportation patterns will change.
People have long known that some locations are much more valuable than others, but quantifying that value has been challenging. Valuing more tangible things is straightforward: it is obvious that, all other things being equal, a 3-bedroom house is more valuable than a 2-bedroom one. But location is different; it is not necessarily obvious why a property on one street might be more valuable than a similar property two streets to the south.
There are a few reasons for this:
For all these reasons, it’s hard to put a clear value on a location.
This is why we built our Location Scores: to quantify what seems unquantifiable.
Our location scores are a collection of numerical ratings that evaluate different aspects of a location – things like transit quality, access to restaurants, and quietness.
We did not develop a single, unified score to rate a location, as not everyone values the same things in a location. Instead, we have 18 scores in total, across three broad categories.
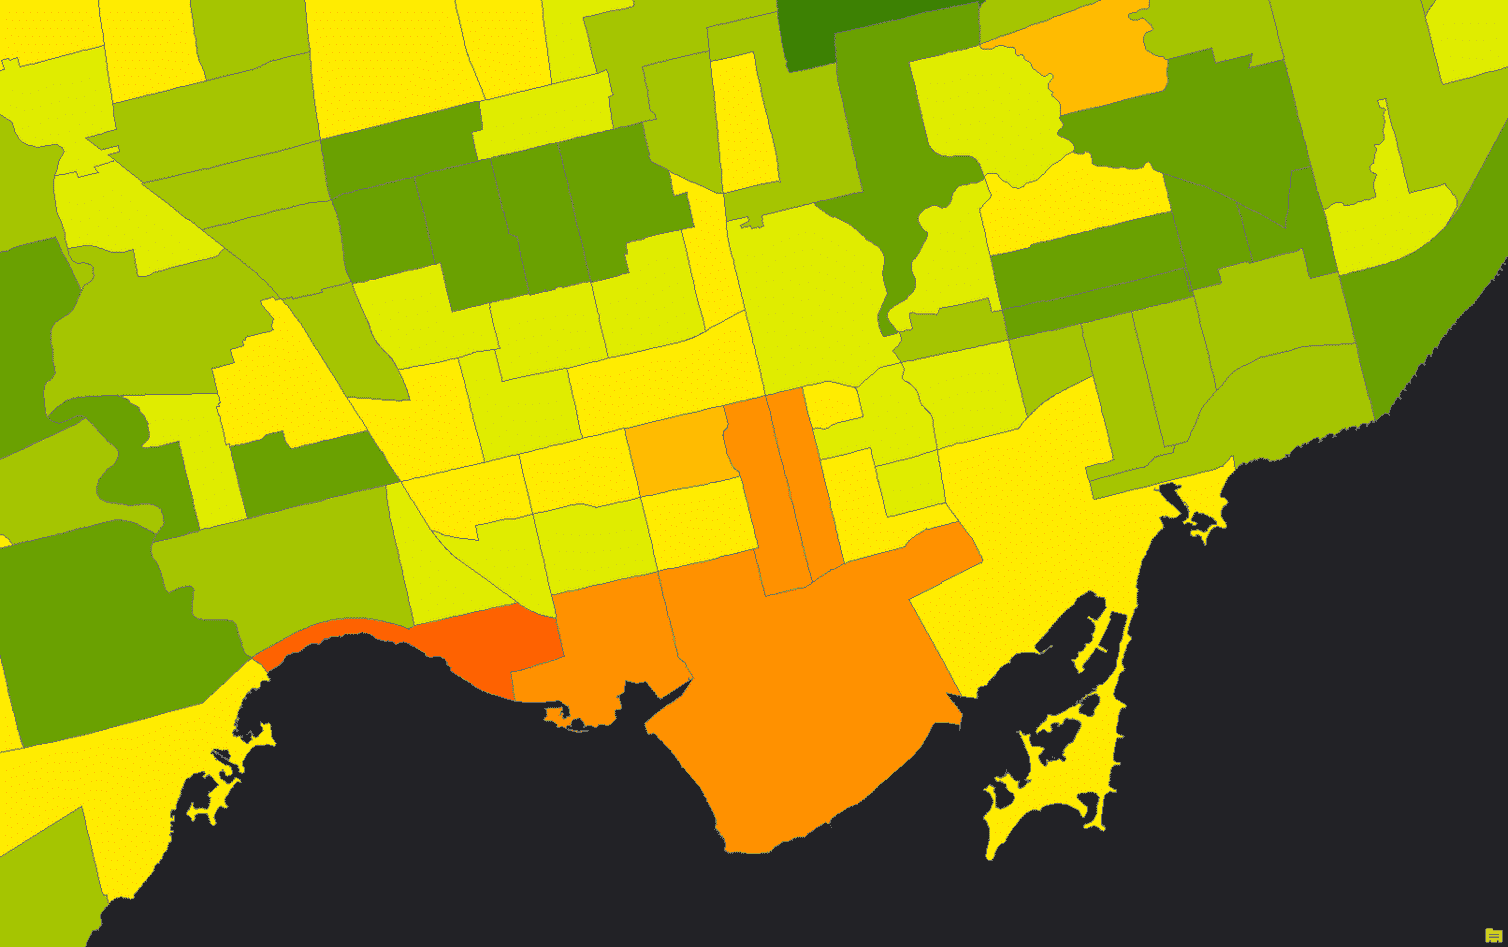
Some of our competitors have built their own scores that assess location characteristics. Often, these scores are calculated at the neighborhood level, as shown below:

This is fine for a high-level analysis, but there can be substantial variation within a single neighborhood.
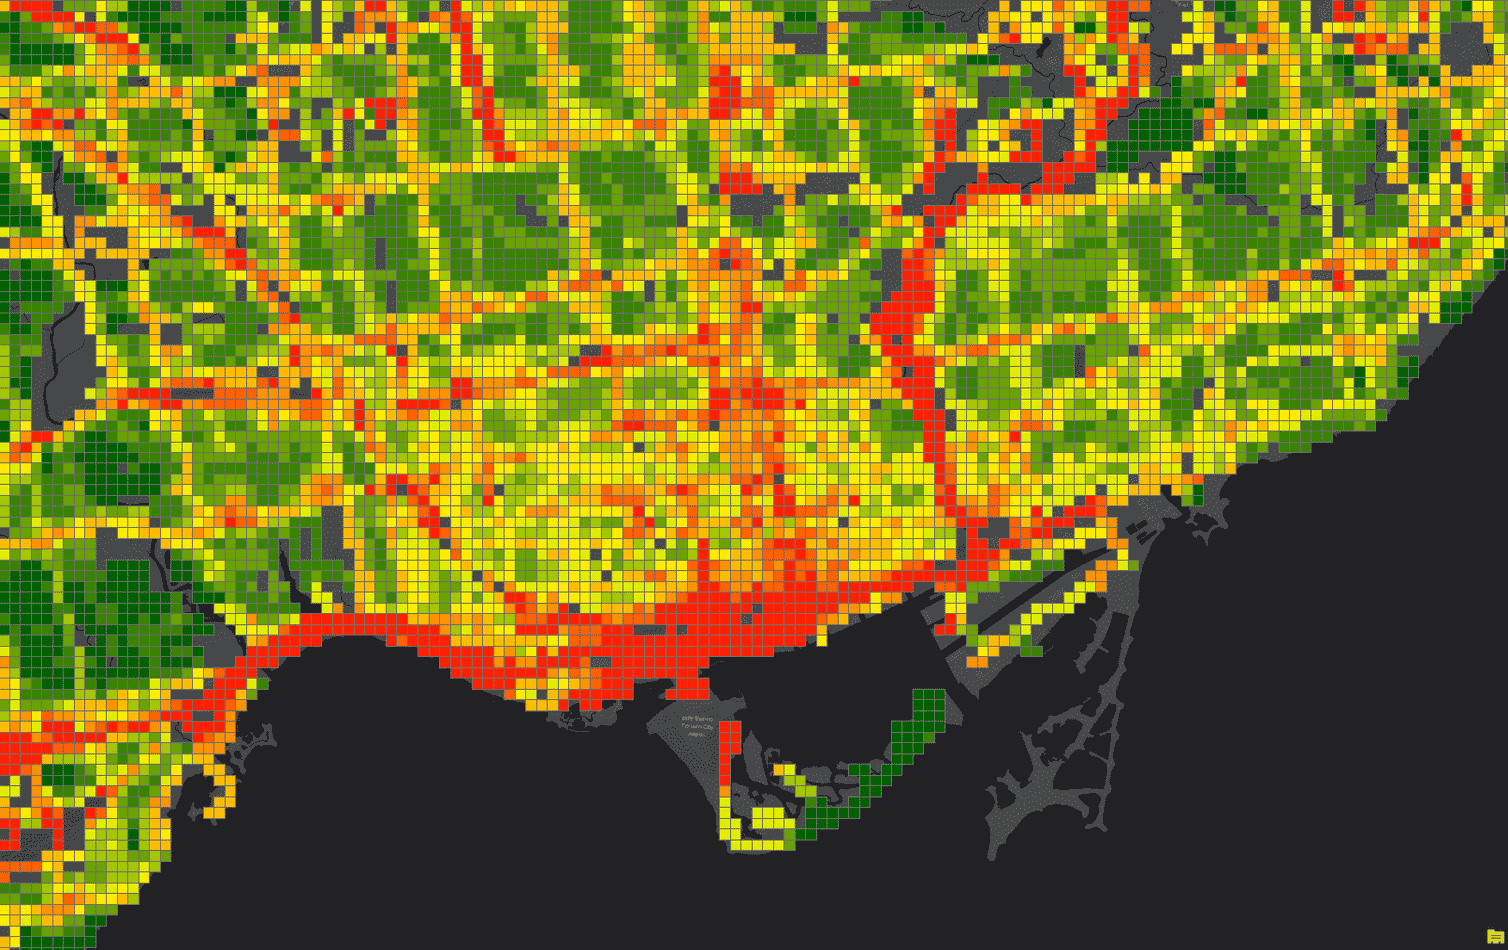
Other competitors, like WalkScore, calculate their scores by placing a grid over a city and calculating one value per grid cell. This approach offers increased granularity over a neighborhood-based approach, as well as mathematical regularity.

However, this approach is divorced from the reality of a city: grid cells don’t correspond to any meaningful location that you interact with. Local Logic’s philosophy is that to properly quantify a city, you need to work with its own unique geography, rather than imposing an abstract logic on it.
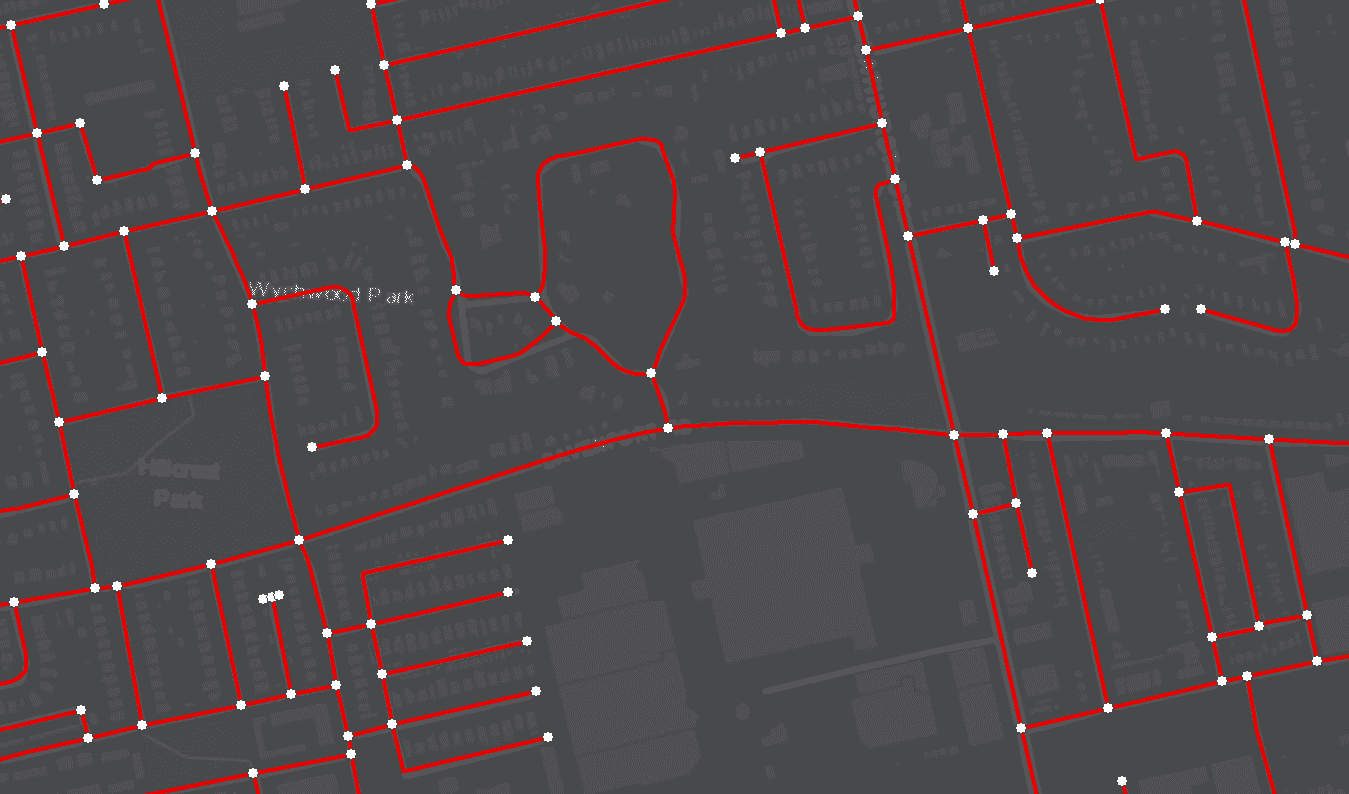
Instead of these two approaches, Local Logic calculates its scores at the street-segment level. A street segment is a section of a street between two adjacent intersections; for example, Lexington Ave in New York City between 42nd Street and 43rd Street. In the following image, the red lines are street segments, starting and ending with white-dot intersections:

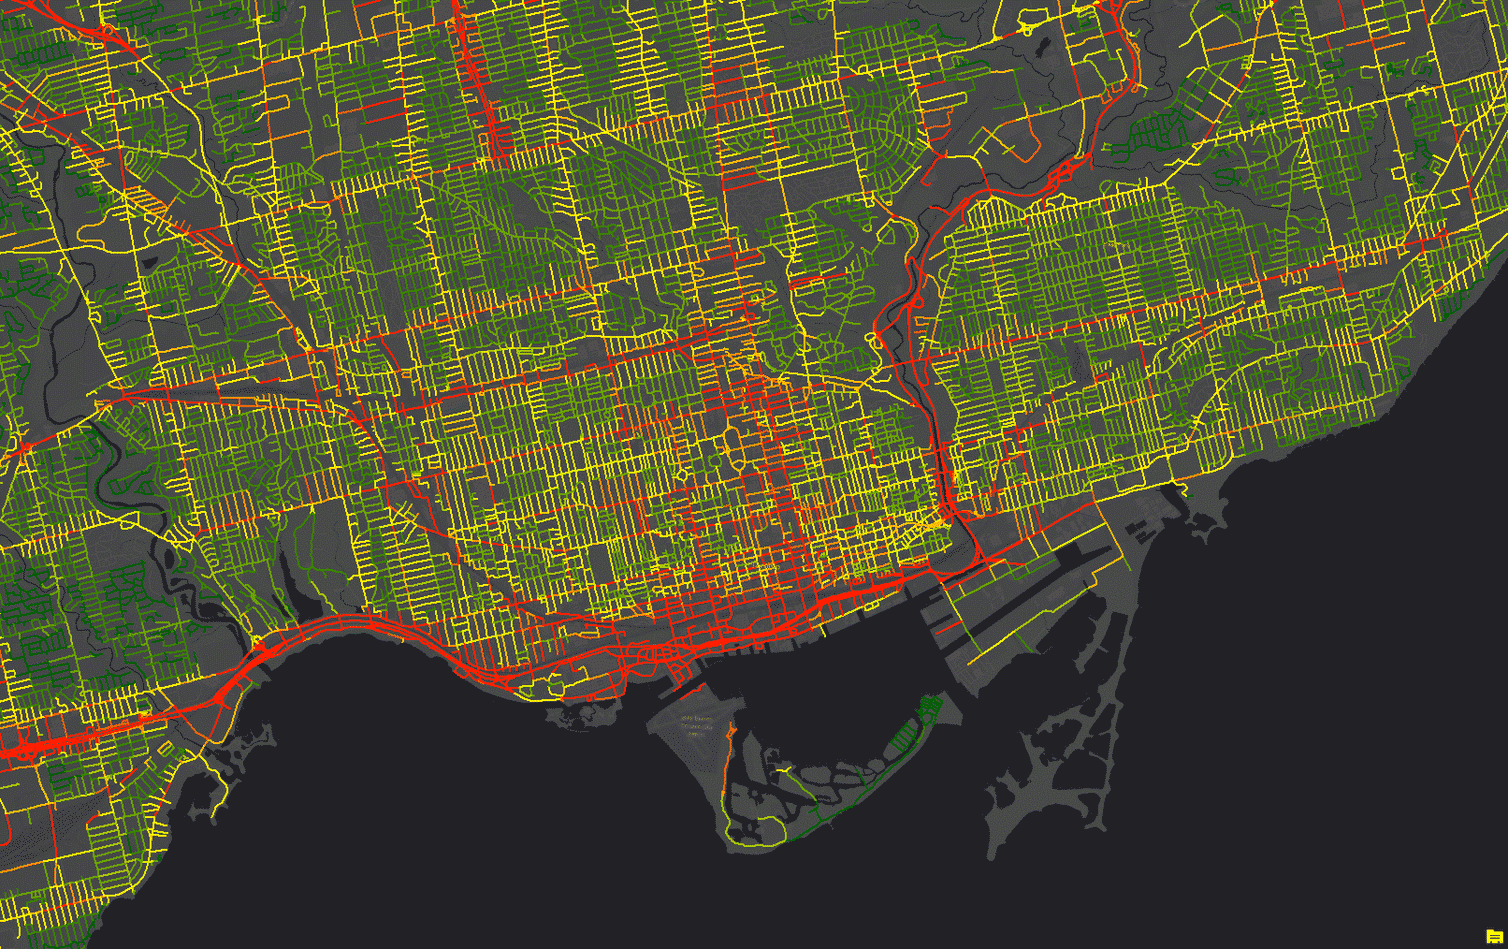
Using street segments as the base unit of analysis allows for a high level of granularity: we can easily distinguish the strengths & weaknesses of two streets that are very close, such as a busy commercial street on one side of a block and a calm residential street on the opposite side. Additionally, street segments are tangible: we experience the public realm of cities primarily at the level of the street, making the street segment a meaningful, relatable reference point. Comparing the map below, which demonstrates Local Logic’s street segment approach, with the maps above using the neighborhood and grid cell approaches, we can see that our street segment approach provides a more nuanced and granular perspective on what it’s like to be in any given place in a city.

Location scores are very versatile and are at the core of most of Local Logic’s products.
In Local Content, users can drop a pin on a map and see how the address in question ranks on each of our 18 scores. When users click on any one of the scores, relevant points of interest are displayed on the map, allowing the user to understand where the score comes from and to explore the specific POIs in question.

💡 Curious about location insights?
Book a demo to learn how to grow your business with location data.