New Search Filter Brings Large Geography Support to Lifestyle Reports
Product
| 10 Mar 2026
How many people live in your neighborhood?
Sounds like a simple question. But when you’re working with data, it’s surprisingly tricky to answer — especially if you’re relying on census data alone.
“Of course, you could just download the free census data. But census boundaries rarely line up perfectly with neighborhood boundaries, and that’s where the trouble begins,” explains Françoise Provencher, Data Technical Lead at Local Logic. “It’s especially problematic in areas with low population density, which is most of the U.S. and Canada, where census blocks are huge and people tend to live in concentrated pockets, not evenly spread out. So, my team devised a few clever tricks to fix that.”
Let’s break down these methods.
Summary
Census data is tied to predefined geographical units — like census blocks in the U.S. or dissemination areas in Canada. These units cover the entire country without overlapping, like puzzle pieces.
Each census block contains information such as how many people live there, their age, income, education, etc. But it doesn’t know exactly where people live within that block — just that they’re somewhere inside of it.
So, how do you calculate the population of a neighborhood?
“Think of your neighborhood boundaries as a cookie cutter placed over those puzzle pieces,” says Provencher. “Counting the population of a piece is pretty straightforward when that piece falls entirely within the boundary. But what about the ones that only partially overlap?”
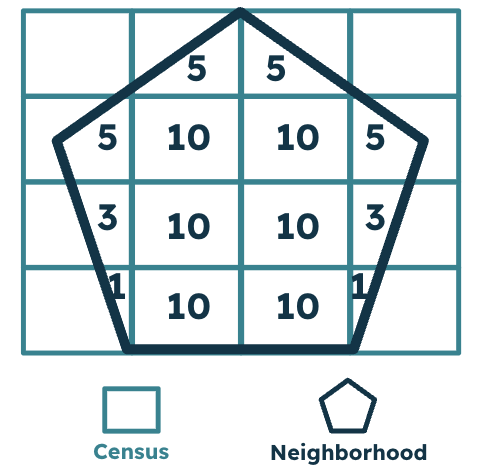
The simplest approach assumes people are evenly spread out. So, if 50% of a census block is inside your neighborhood, you assume 50% of the people are too. But that’s not always true.
Instead, Local Logic asks, “What’s the range of possible values and how confident are we in that range?”
“We use the binomial distribution to estimate a more accurate range,” says Sarah Amundrud, PHD, Senior Data Scientist and the architect of our Neighborhood Demographics algorithm at Local Logic. “If 20% of a census block containing 100 people falls within a neighborhood, we don’t just assume 20 people live there. Instead, we estimate that, if people are randomly distributed, there’s a 90% chance the true number is between 14 and 27.”
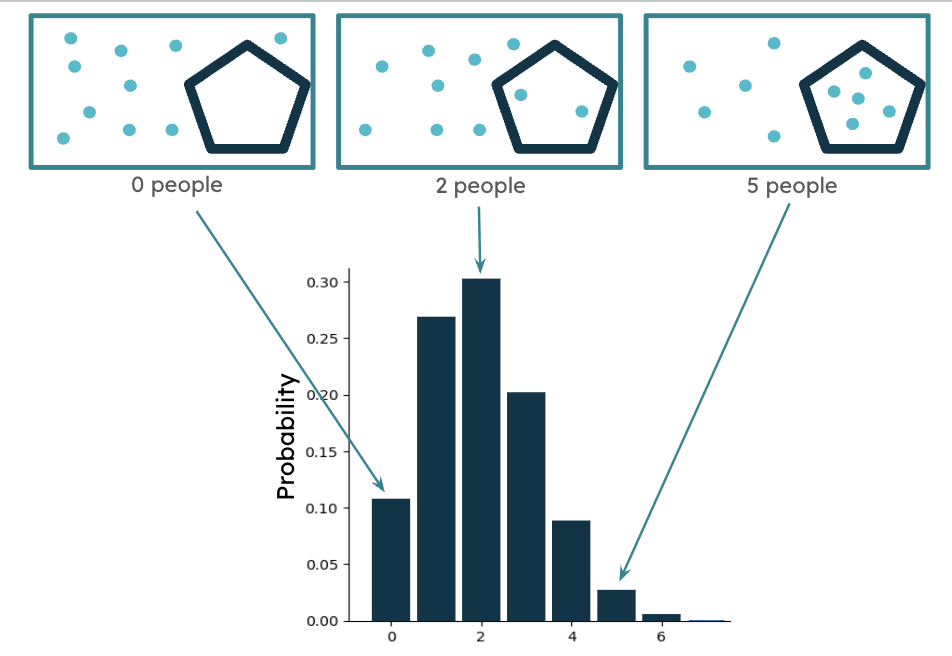
The binomial distribution helps to estimate ranges when the population is randomly distributed.
Census figures themselves are estimates and come with their own built-in margins of error. By layering our statistical model on top of that, we account for both the uncertainty in the census data and the uncertainty introduced when neighborhood boundaries don’t perfectly align.
The result is a more transparent and rigorous approach: instead of pretending population estimates are precise, we embrace the uncertainty and quantify it. So, in place of a single number, we get a confidence interval, which is a more honest, nuanced estimate.
“I love that we include upper and lower bounds,” says Provencher. “It gives our clients a clear sense of how confident they can be in our Neighborhood Demographics data, which helps them make smarter, more informed decisions.”
In fact, this level of precision directly powers how Local Logic tailors its solutions. Our IO Reports use this information to dynamically adjust data storytelling — from how data is formatted, to the disclaimers displayed, to the language we use to frame insight confidence.
This means that users don’t just get numbers; they get clear, contextualized insights they can actually trust.
The statistical approach outlined above works well in cities, where census blocks are small and people are fairly spread out.
But rural areas? Totally different story.
Take Lincoln, Montana — a small community in Lewis and Clark County that straddles two massive census blocks. Using our previous method (again, assuming people are randomly distributed throughout the census block), you’d estimate that only 35 to 92 people live there. But we know from official counts that the real number is closer to 1,000.
Why the discrepancy?
Because most of the land in those rural blocks is uninhabited — forests, farmland, mountains, etc. People are clustered in a small area (the actual town), not evenly sprinkled across the entire block.
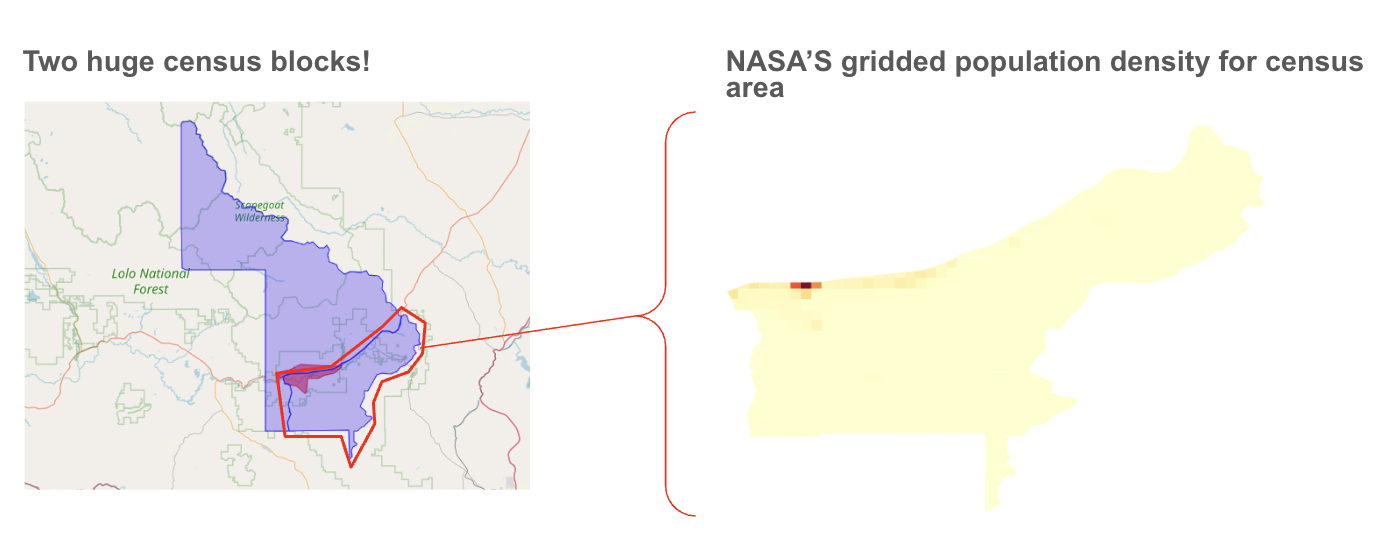
“We need more information on where people actually live within a census block versus which areas are uninhabited,” says Amundrud. “NASA publishes a gridded population dataset that factors in land cover and other geospatial indicators.¹ By using this data, Local Logic can tell which parts of a block are likely inhabited and weigh the census data accordingly.”
In Lincoln’s case, NASA’s data showed that 81% of the block’s population lived within the area that matches the town. By applying that weighting, we got a more accurate estimate: 705 to 1,190 people, which is much closer to reality.
Instead of assuming people are evenly distributed, this method applies a smarter estimate that reflects real-world settlement patterns. It dramatically improves the accuracy of demographic estimates in rural and low-density areas. It’s how Local Logic avoids big mistakes that would come from treating empty forests the same as small towns — and why our neighborhood-level data is much more trustworthy than raw census figures alone.
But how did we know how many people live in Lincoln in the first place?
Sometimes, a neighborhood aligns perfectly with a Census Place — a statistical area the Census Bureau already reports on. In those cases, like Lincoln, Montana, we use the census data directly.
In fact, we included Lincoln in the example above not because we needed to estimate its population, but because it provides a helpful ground truth to validate our method.
Many of Local Logic’s geographic boundaries match census places like this, and when they do, there’s no need for complex modeling. No fancy techniques required.
But for the tens of thousands of neighborhoods, municipalities, and cities that don’t, we do the data science heavy lifting, so that our clients don’t have to.
There are a few ways you can tap into Local Logic’s granular demographic insights:
 Visual representation of Local Logic’s Demographics API
Our Demographics API delivers rich, comprehensive demographic data — including population size, age distribution, education, income levels, household composition, language, and more — for specific locations (like neighborhoods, cities, or postal codes), offering valuable insights into a community and its characteristics.
It’s pre-aggregated and ready to use, giving you accurate, boundary-aware insights without the need to stitch together messy census boundaries. Whether you’re building a site selection tool, enhancing a real estate search experience, or creating a custom report, the Demographics API provides detailed and reliable insights, which help users make better decisions and improve engagement.
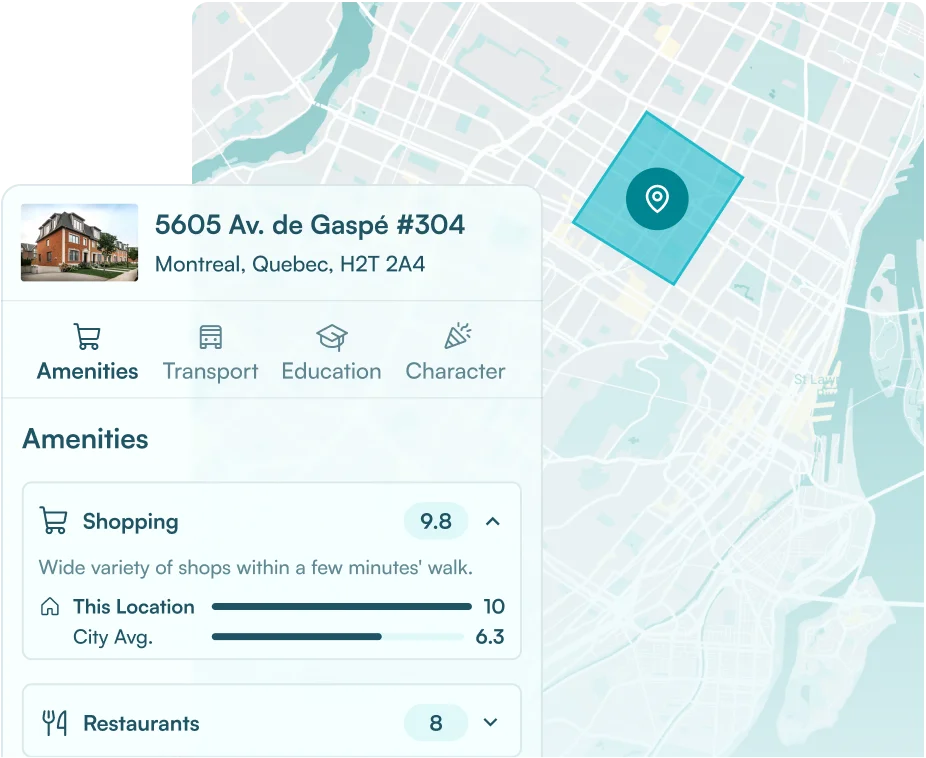
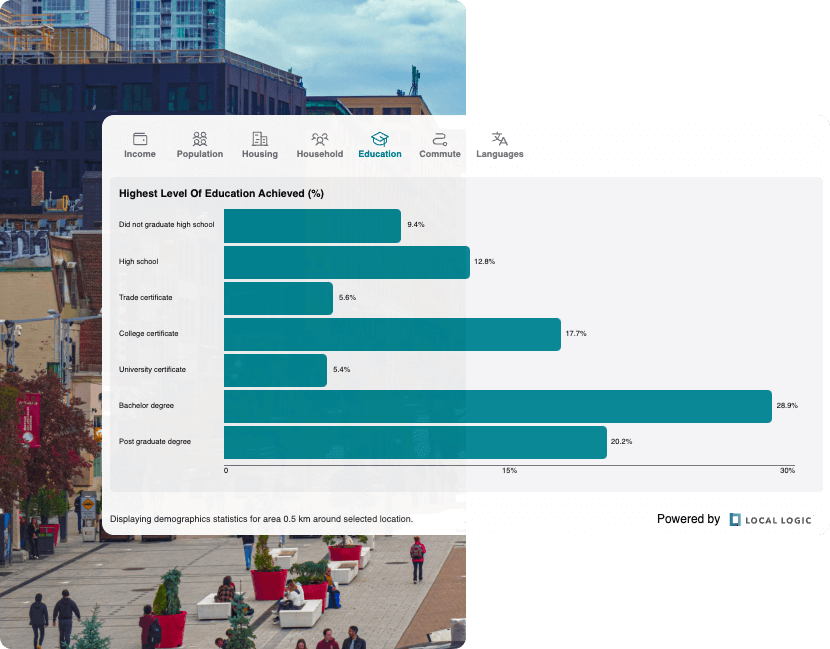 Neighborhood Demographics as shown in Local Demographics
Local Demographics is an embeddable widget that brings trusted, census-based insights directly to your real estate platform without any code or complex integrations. It displays key community stats like population size, age distribution, income, education levels, and household types. With an intuitive visual layout and seamless integration, Local Demographics helps consumers better understand the character of a neighborhood — right from the listing page.
Built for speed and simplicity, it’s the fastest way to enrich your website with demographic insights that help users feel confident about where they’re searching, all while boosting on-page engagement.
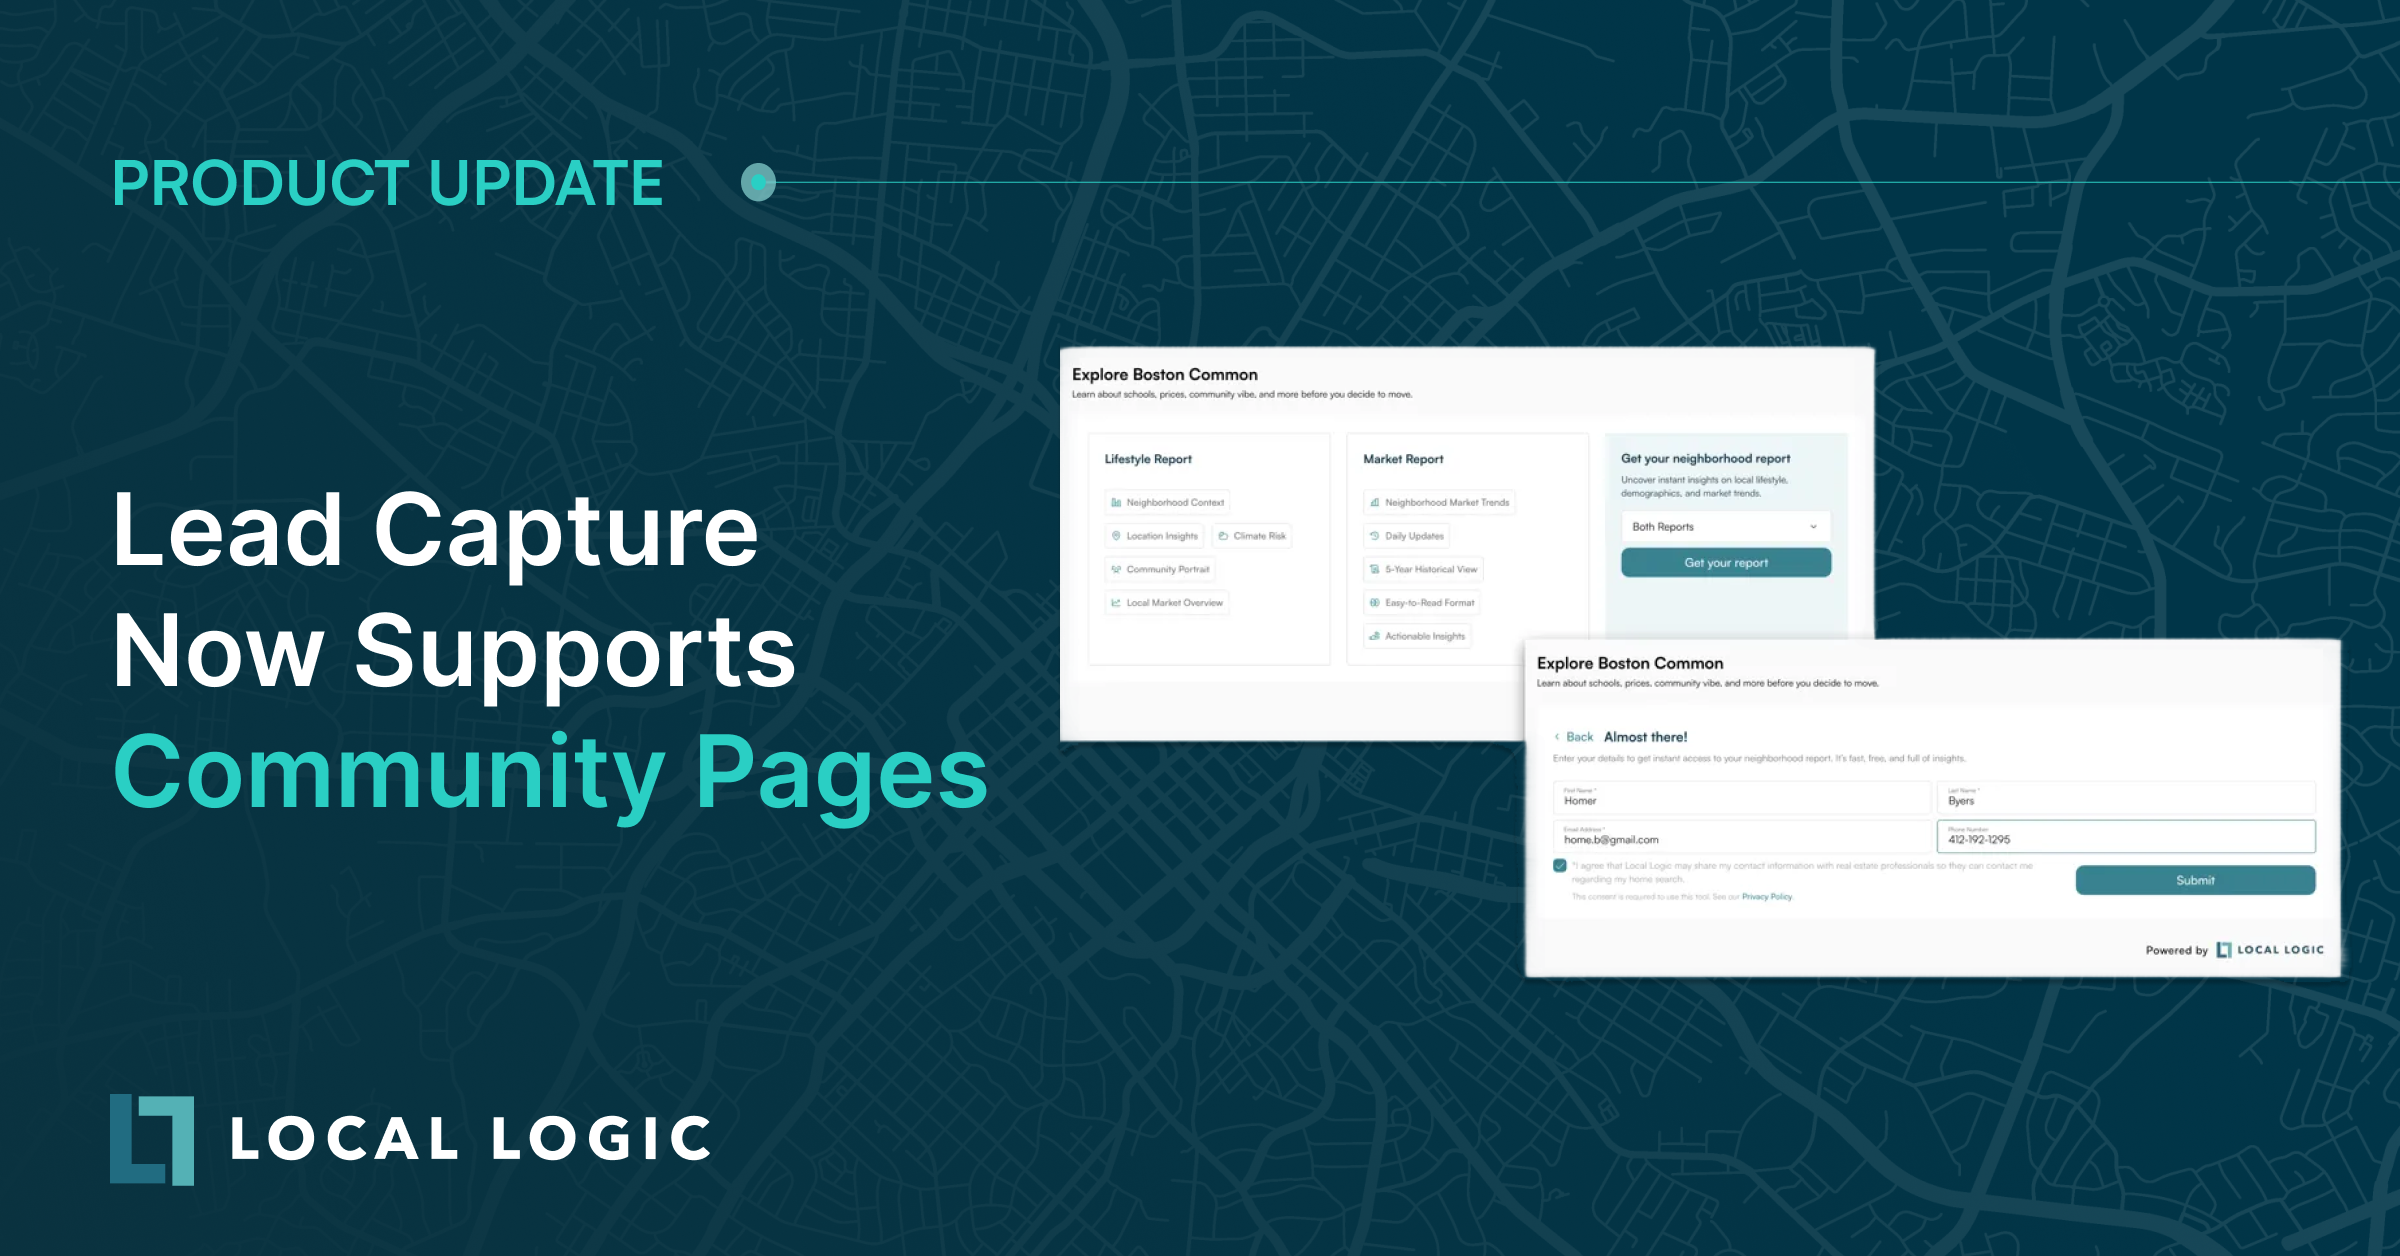
 Neighborhood Demographics as shown in NeighborhoodWrap
NeighborhoodWrap is a plug-and-play tool that adds rich, hyperlocal insights directly onto real estate listing pages. It helps brokerages stand out with out-of-the-box neighborhood pages featuring dynamic data on nearby schools, demographics, lifestyle scores, local amenities, property value drivers, market trends, and much more.
With just a few lines of code, you can enhance your site with engaging, data-driven neighborhood content that keeps users on-page longer and enhances online presence.
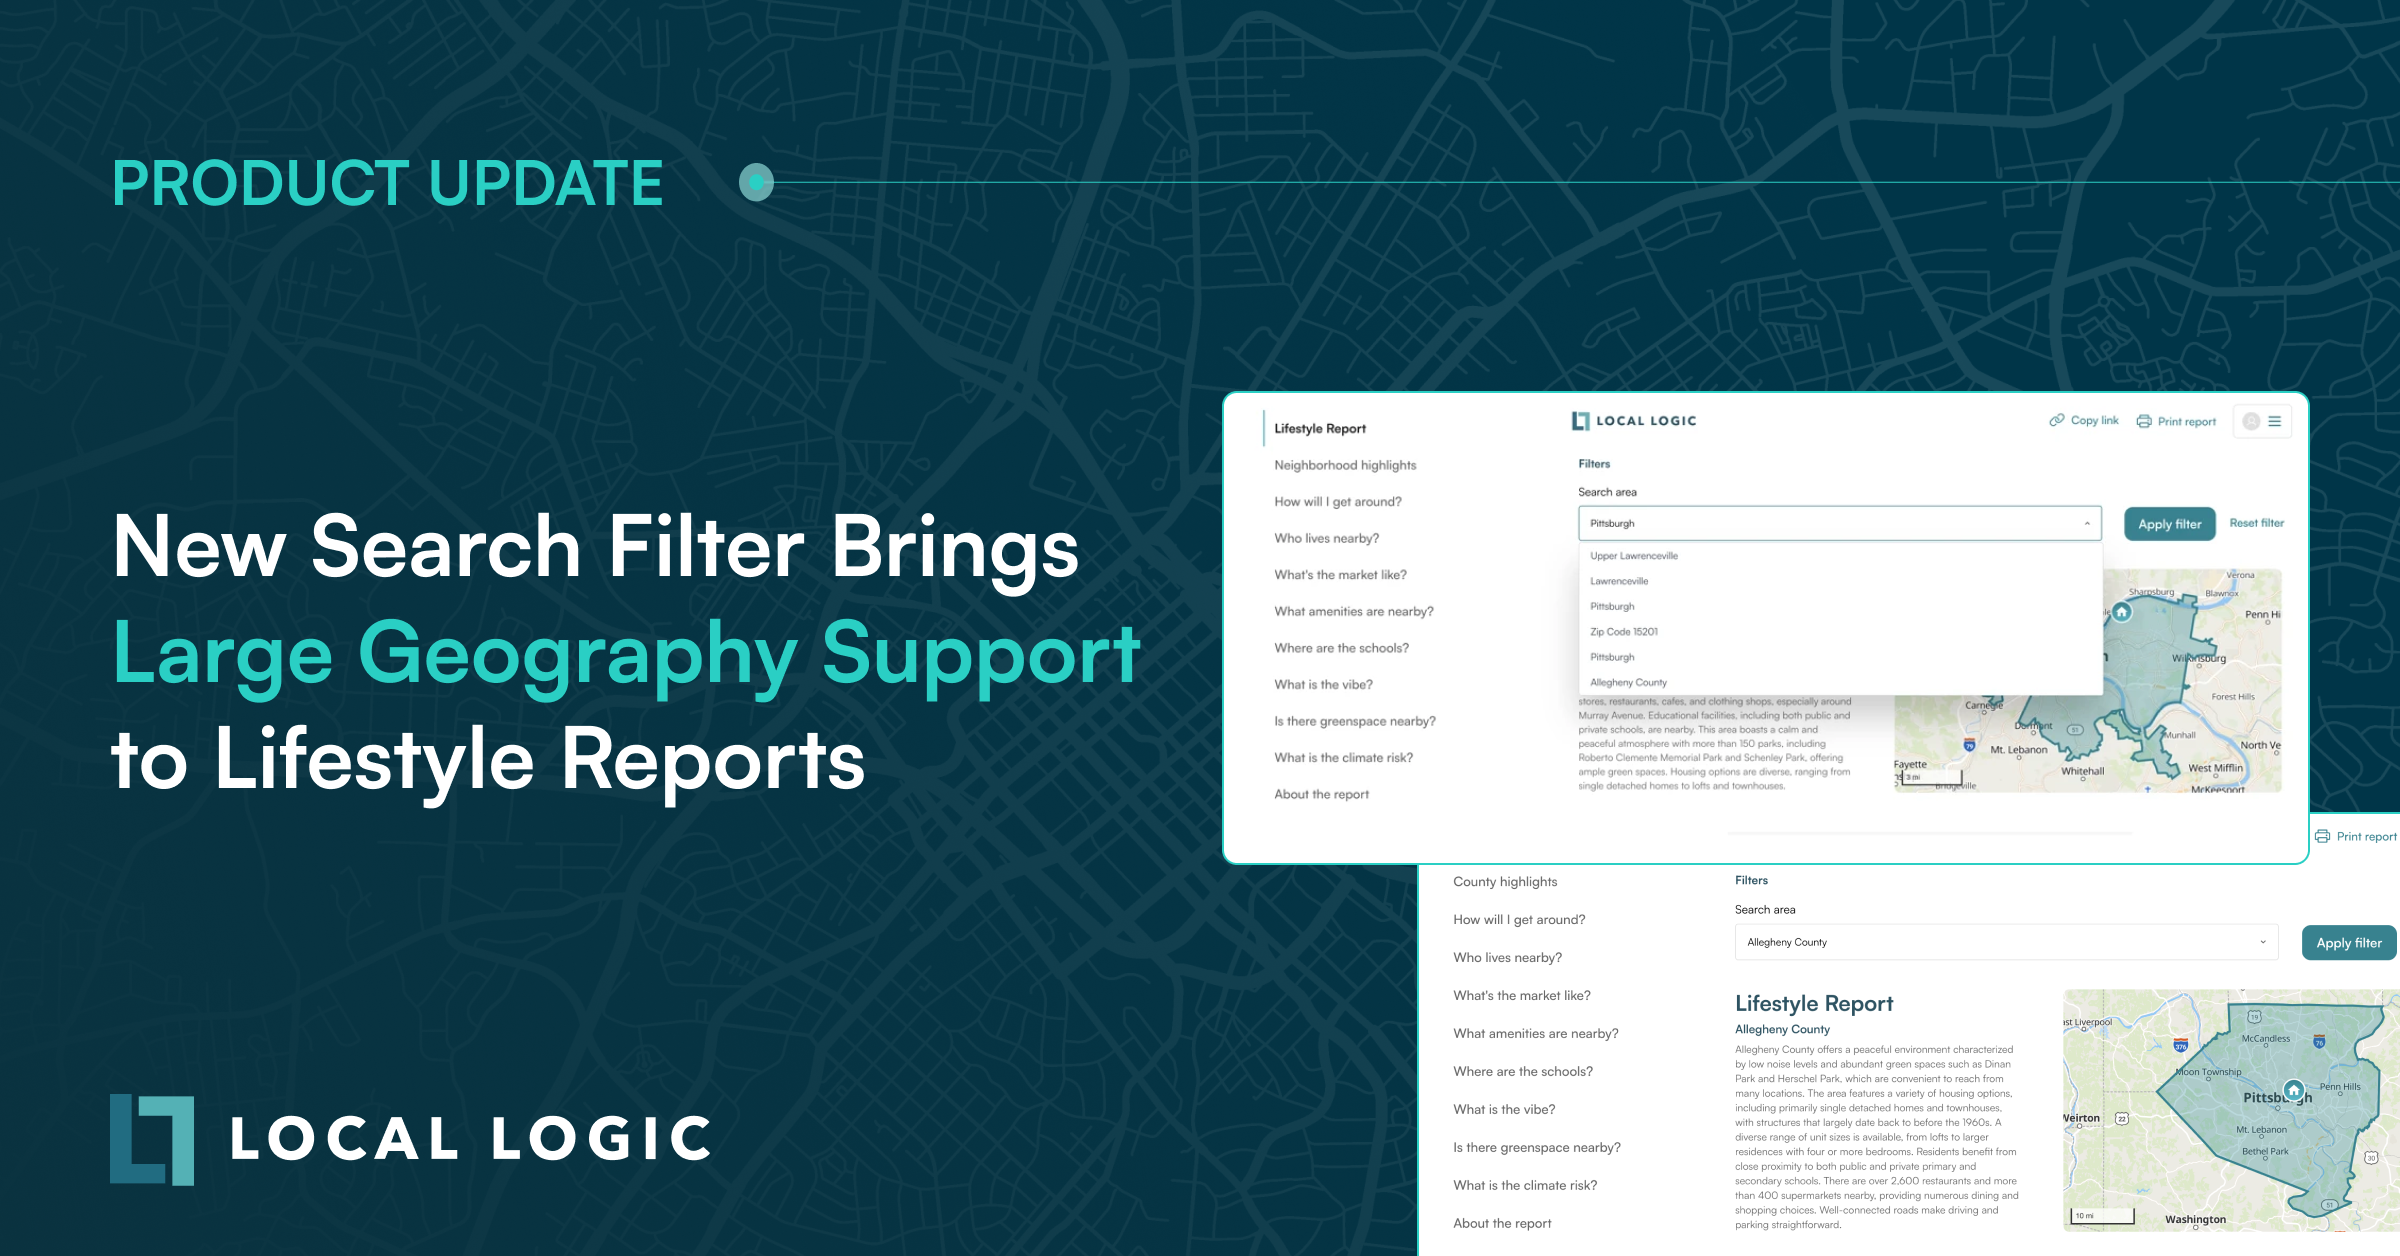
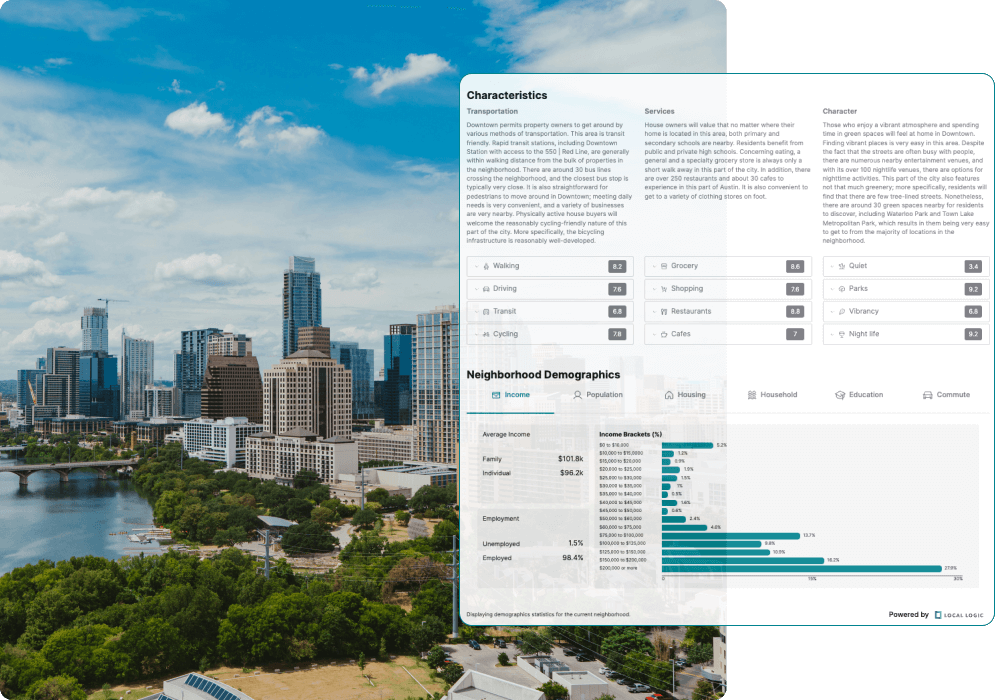
 Neighborhood Demographics as shown in the IO Reports
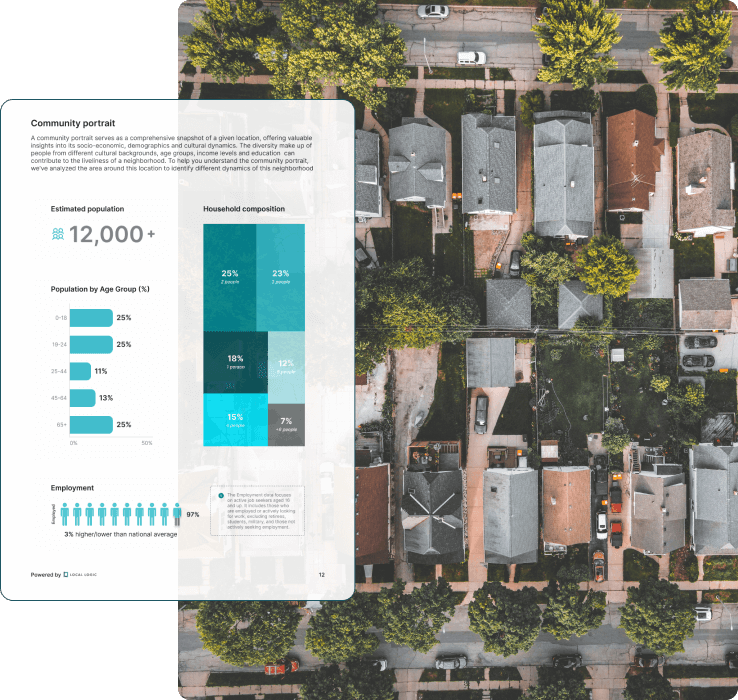
IO Reports are ready-to-share, data-rich reports that combine lifestyle insights, including community portraits and demographics, and market trends into a single, easy-to-digest format.
Providing a comprehensive view of a community’s character and real estate market dynamics, these reports help you analyze potential sites, understand the surrounding neighborhood, and communicate location value — all without wrangling raw data. Designed to highlight local expertise, IO Reports turn complex location intelligence into clear, decision-ready storytelling.
By blending census data with advanced statistical modeling and satellite-driven population grids, we give our clients clarity where others offer guesswork. On top of improving accuracy, our methodology powers smarter planning, stronger storytelling, and better outcomes by helping clients trust the data they use. It also highlights the advanced data science that sets Local Logic apart.
For companies trying to build this kind of solution themselves, we make the decision easier: buy, don’t build. We’ve already done the hard work, so you don’t have to.
¹ Center For International Earth Science Information Network-CIESIN-Columbia University. (2017). Gridded Population of the World, Version 4 (GPWv4): Population Density, Revision 11 (Version 4.11) [Data set]. Palisades, NY: Socioeconomic Data and Applications Center (SEDAC). https://doi.org/10.7927/H49C6VHW
Want to see how our granular demographics insights can power your platform?
Book a demo to see our location intelligence solutions in action.