Browse Solutions by
Use Cases
Industries
Products
APIs
Help consumers find the perfect property based on their lifestyle preferences.
Enhance property listings' visibility and user engagement with dynamic local insights.
Improve SEO rankings by positioning your brand as the go-to source for neighborhood knowledge.
Empower your agents with unique location insights to enhance performance, attract talent, and boost retention.
Showcase the community benefits of your real estate projects.
Determine the viability of your real estate investments with comprehensive location insights.
Validate the potential of your development plans, course-correct, and convince stakeholders.
Shape more sustainable cities through strategic planning guidance.
Ensure urban expansion is aligned with long-term strategic goals, optimizing land use and enhancing community benefits.
Identify the key locations that meet your specific investment criteria.
Drive better consumer engagement with intuitive location insights.
Leverage intuitive insights to improve lead quality and member satisfaction.
Enhance client satisfaction and drive sales with actionable location intelligence.
Empower your platform with granular and flexible location insights.
Gain advanced location intelligence for your homebuilding projects.
Maximize investment returns and enhance your portfolio.
Inform urban planning, optimize infrastructure, and enhance community well-being.
Empower your agents & enhance client satisfaction with granular lifestyle & market reports.
Give consumers a deep understanding of any property's location.
Display powerful demographics insights, increase user engagement, and improve SEO performance.
Help consumers find areas that are suitable for their lifestyle preferences with a map-based tool.
Display schools and filter them by type, level, and languages offered with a map-based search tool.
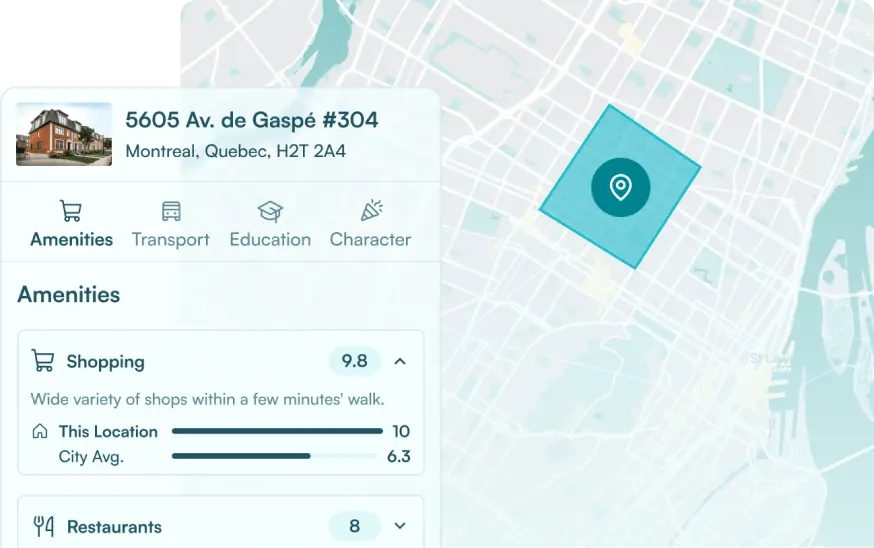
Discover a property's location lifestyle characteristics to help consumers decide if it meets their needs.
Position your agents as local experts with the industry’s most robust location reports.
Showcase local expertise and increase organic traffic with out-of-the-box neighborhood pages.
Get detailed demographic data for neighborhoods or specific locations.
Accurately assess the quality of transportation, services, and features of a location.
Unlock over 90,000 neighborhood, borough, and city descriptions, maps, and more.
Present the most relevant information for any location across the US and Canada, with context.
Get a comprehensive overview of any location with detailed insights into POI, Scores, Demographics, and more.
Access detailed market statistics and insights for any neighborhood.
Uncover the key location characteristics driving property values up or down.
Identify neighborhoods similar to a target one to help users discover new areas with comparable characteristics and amenities.
Find out how suitable a home is based on the schools available in the area.
Help consumers better understand risks associated with heat, storm, fire, drought, and flood.
1-8 of 118 results
Insights
| 10 Jul 2025
Partnerships
| 09 Jun 2025
| 29 May 2025
| 28 May 2025
| 19 May 2025
| 05 May 2025
Insights, Partnerships
| 22 Apr 2025