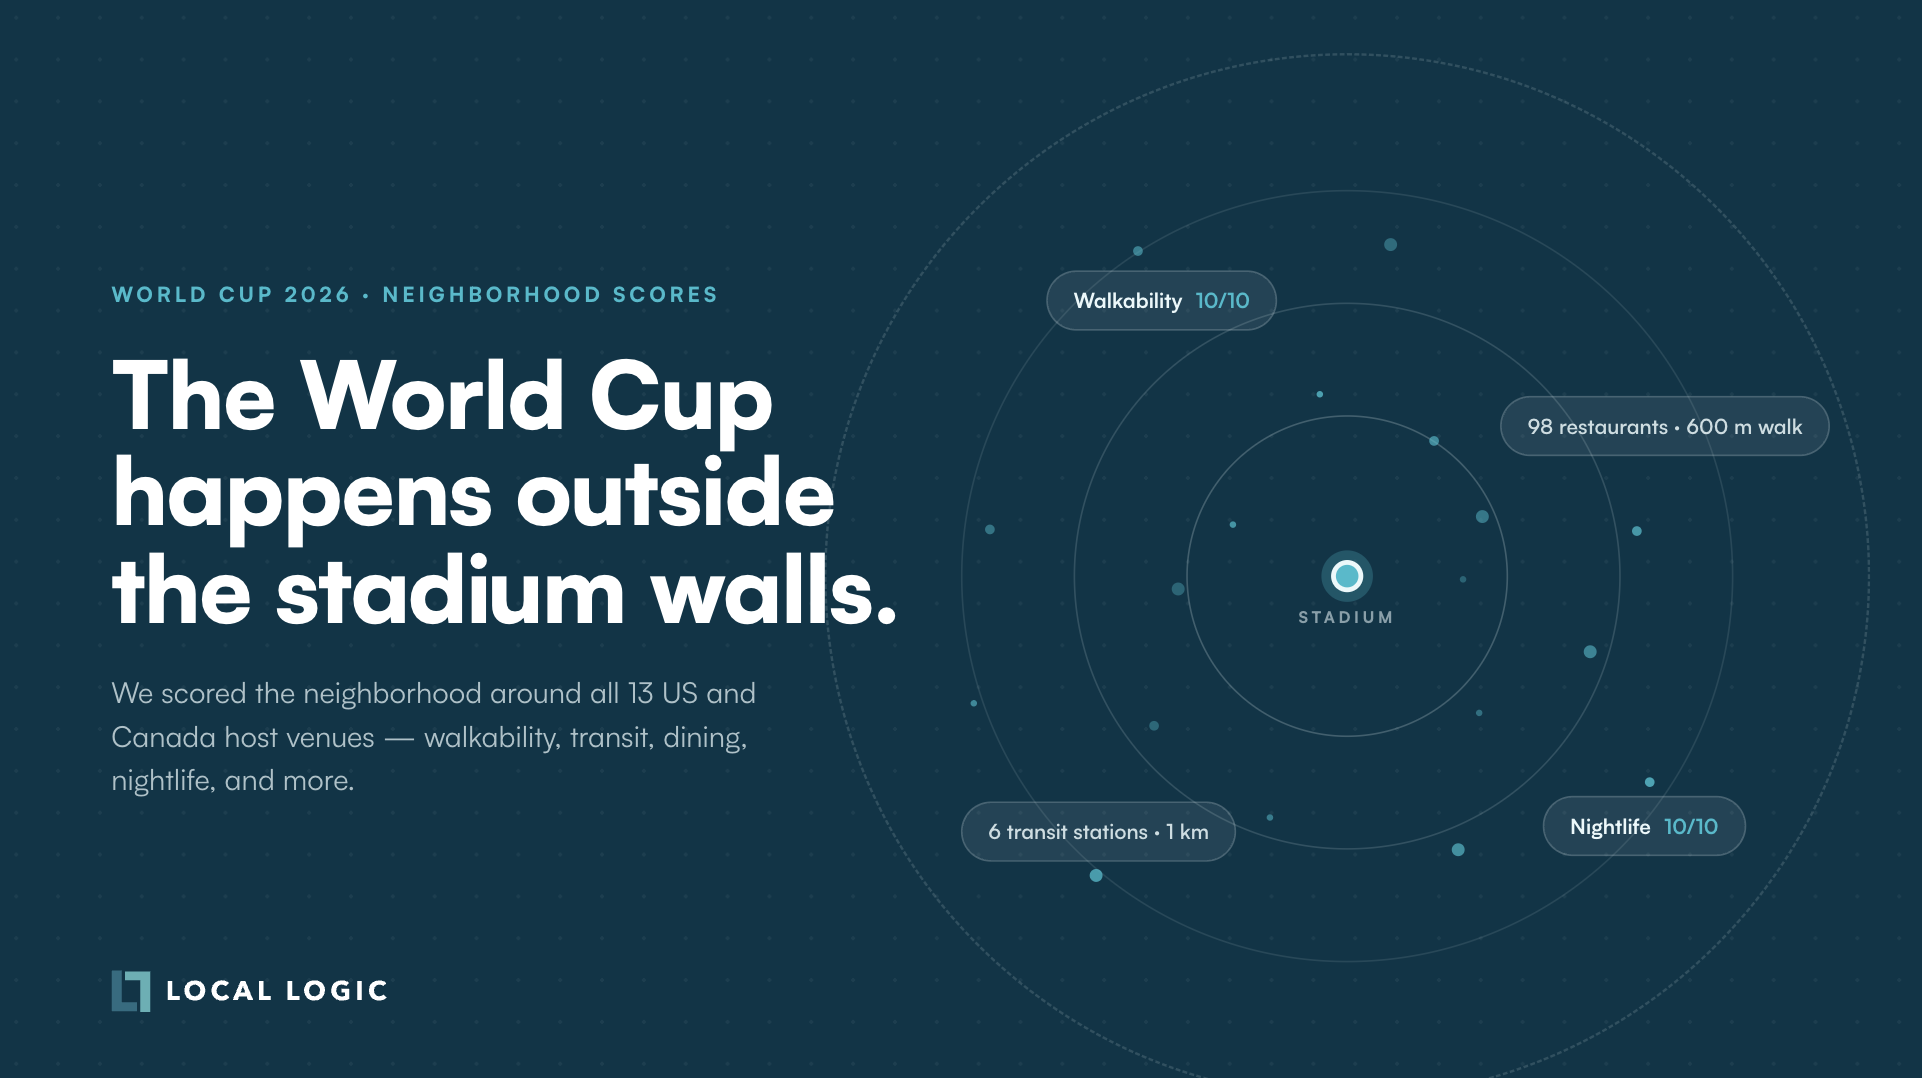
The 2026 World Cup Happens Outside the Stadium Walls
Insights
| 11 Jun 2026
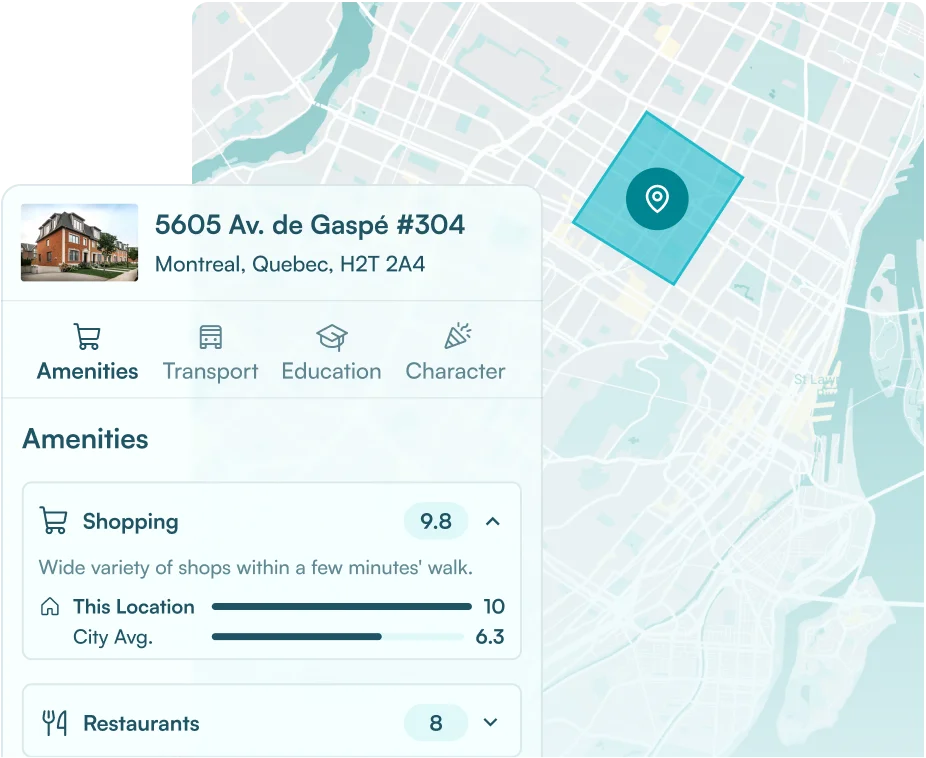
Like many large cities in North America, Montreal is facing challenges with urban density, investments in transport infrastructure, and the reality of climate change. To better understand these issues, we analyzed how locations that reduce car dependency are built and used.
This analysis compared three main variables:
Our objective was to validate whether locations offering good access to basic needs needed a high population density to support these businesses and whether these locations correlated with lower automobile use.
Our walkability score includes frequently-visited businesses, such as grocery stores and pharmacies, as well as their pleasantness to access – for example, a business located across an overpass is penalized.
The analysis looked at these different variables for each street segment rather than on a larger scale in order to properly analyze the impact of the built environment and land use.
The results are telling.
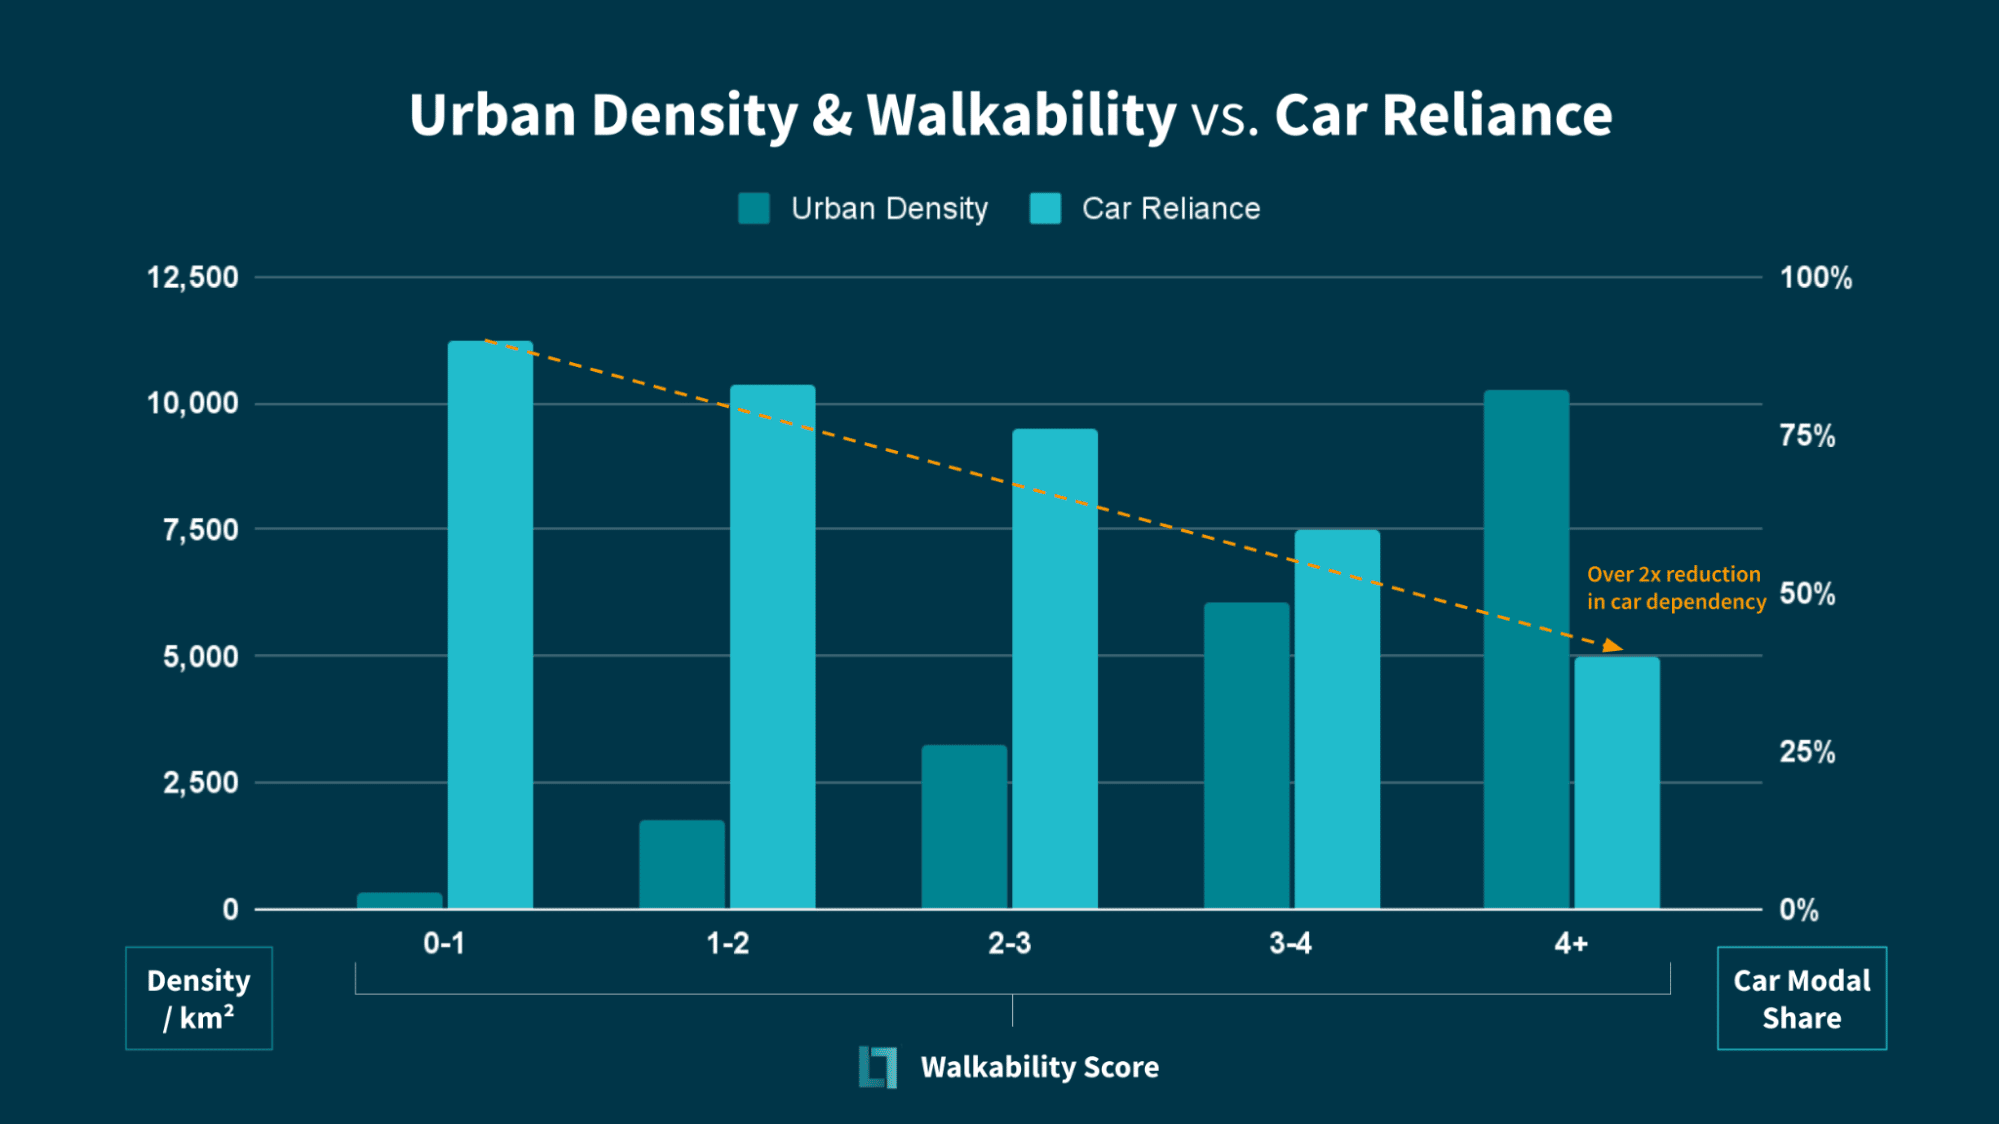
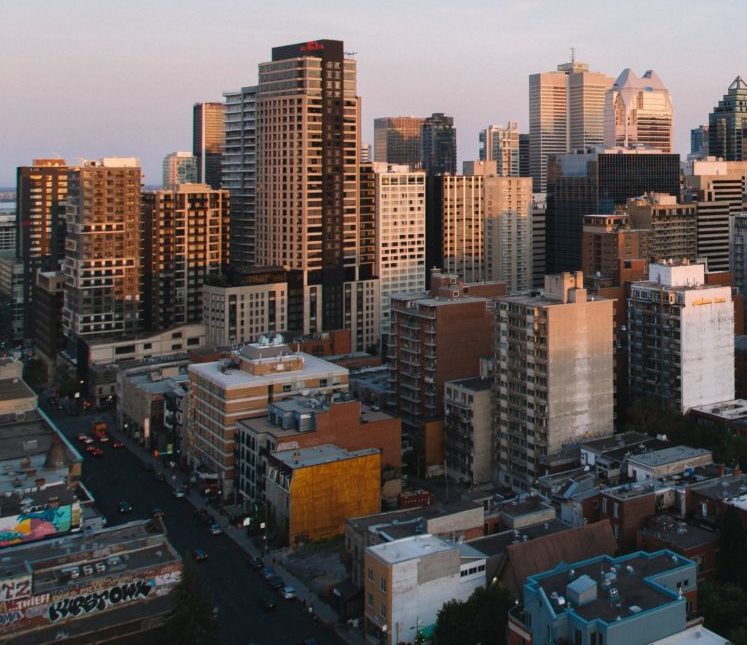
It is important to mention that in the absence of nearby services, a dense environment in itself does not necessarily lead to a decrease in car usage. Indeed, new developments on Île du Tremblay in Laval have one of the highest urban densities in the Greater Montreal area but also lead the pack in car modal share at over 85%.
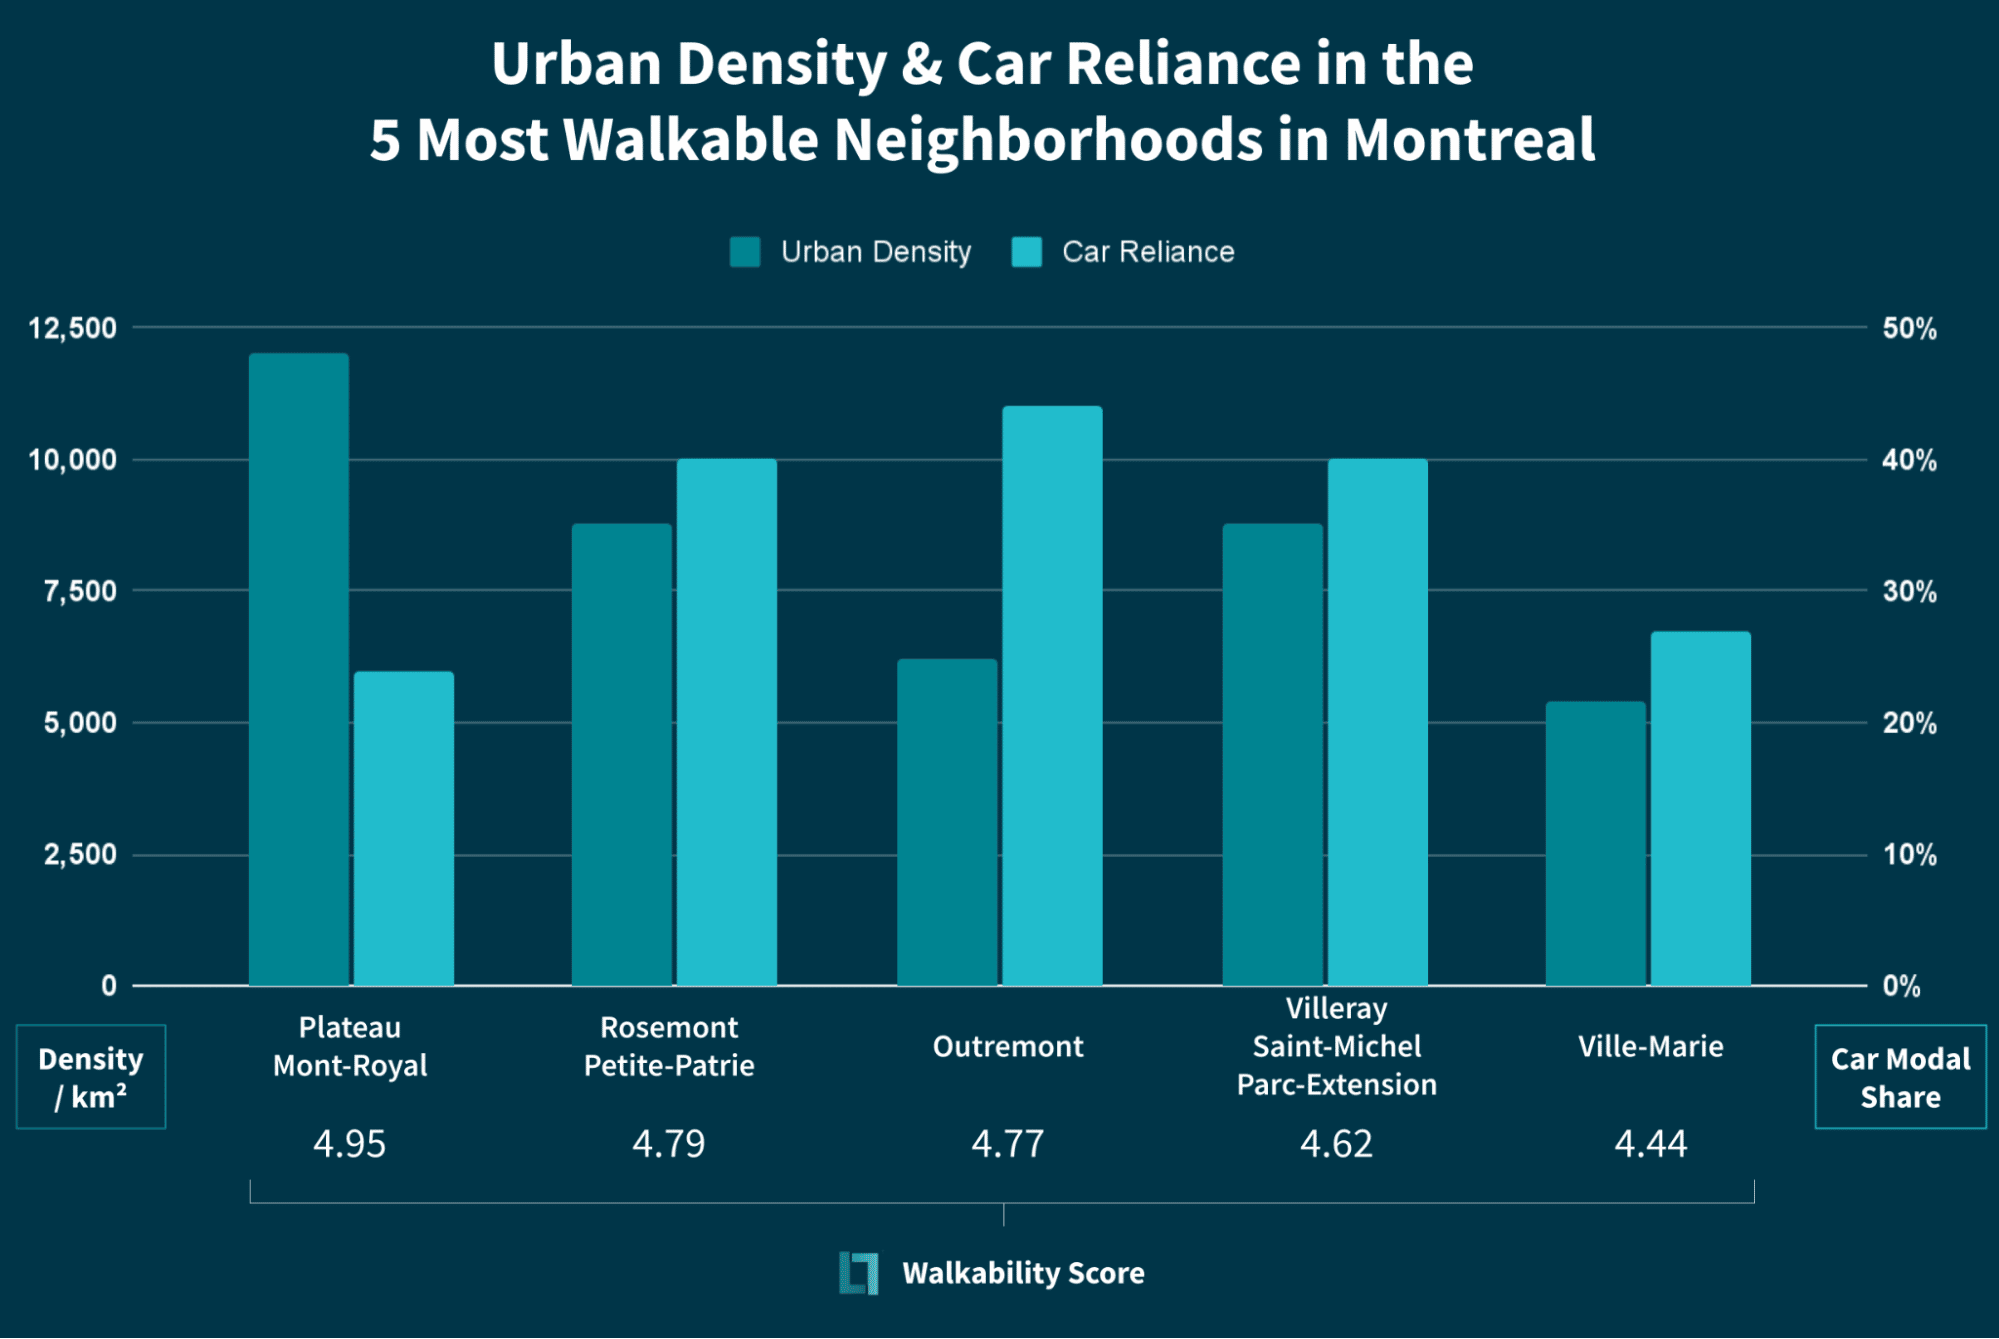
We have also aggregated the results at the neighborhood level to understand which locations are most conducive to alternative modes of transportation and where the largest proportion of people who do not use a car as their primary mode of travel is located.
This is how the five most walkable neighborhoods in Montreal compare:
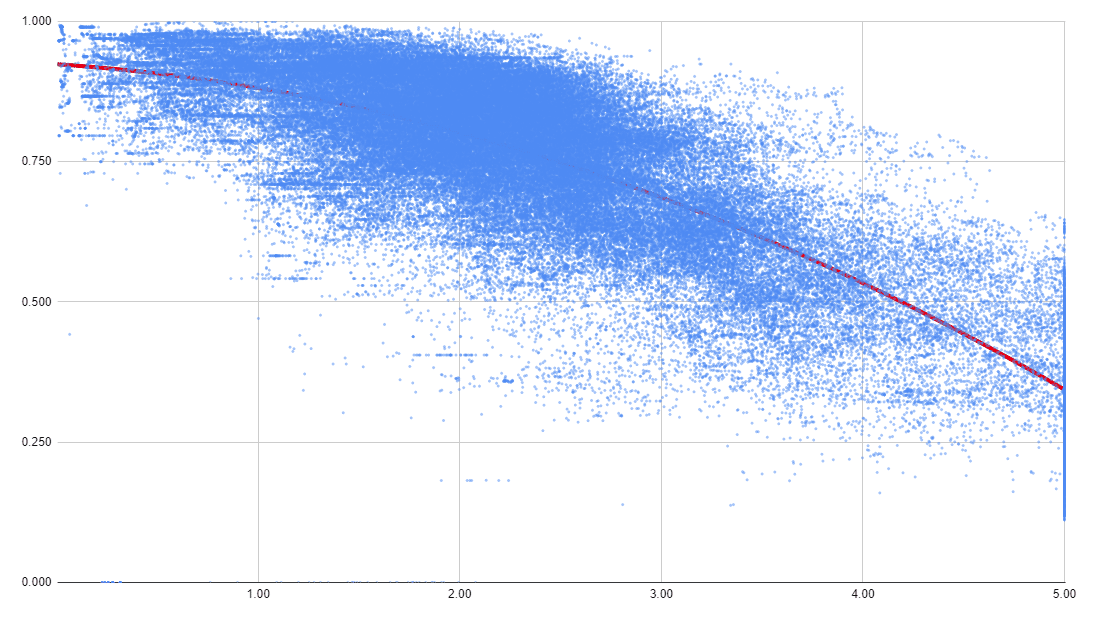
Our figures show that access to services correlates more with car use than density (65% vs. 34%), but a certain density is necessary to support a good service offer.
There is a dire need to reduce greenhouse gas emissions over the next few years. Additionally, we know that the most significant source of emissions comes from automobile use and that a built environment that is both dense and offers many services allows for modal transfer. Therefore, it is essential to include urban planning tools within our reach.
💡 Curious about location insights?
Get a demo to learn how to grow your business with location data.