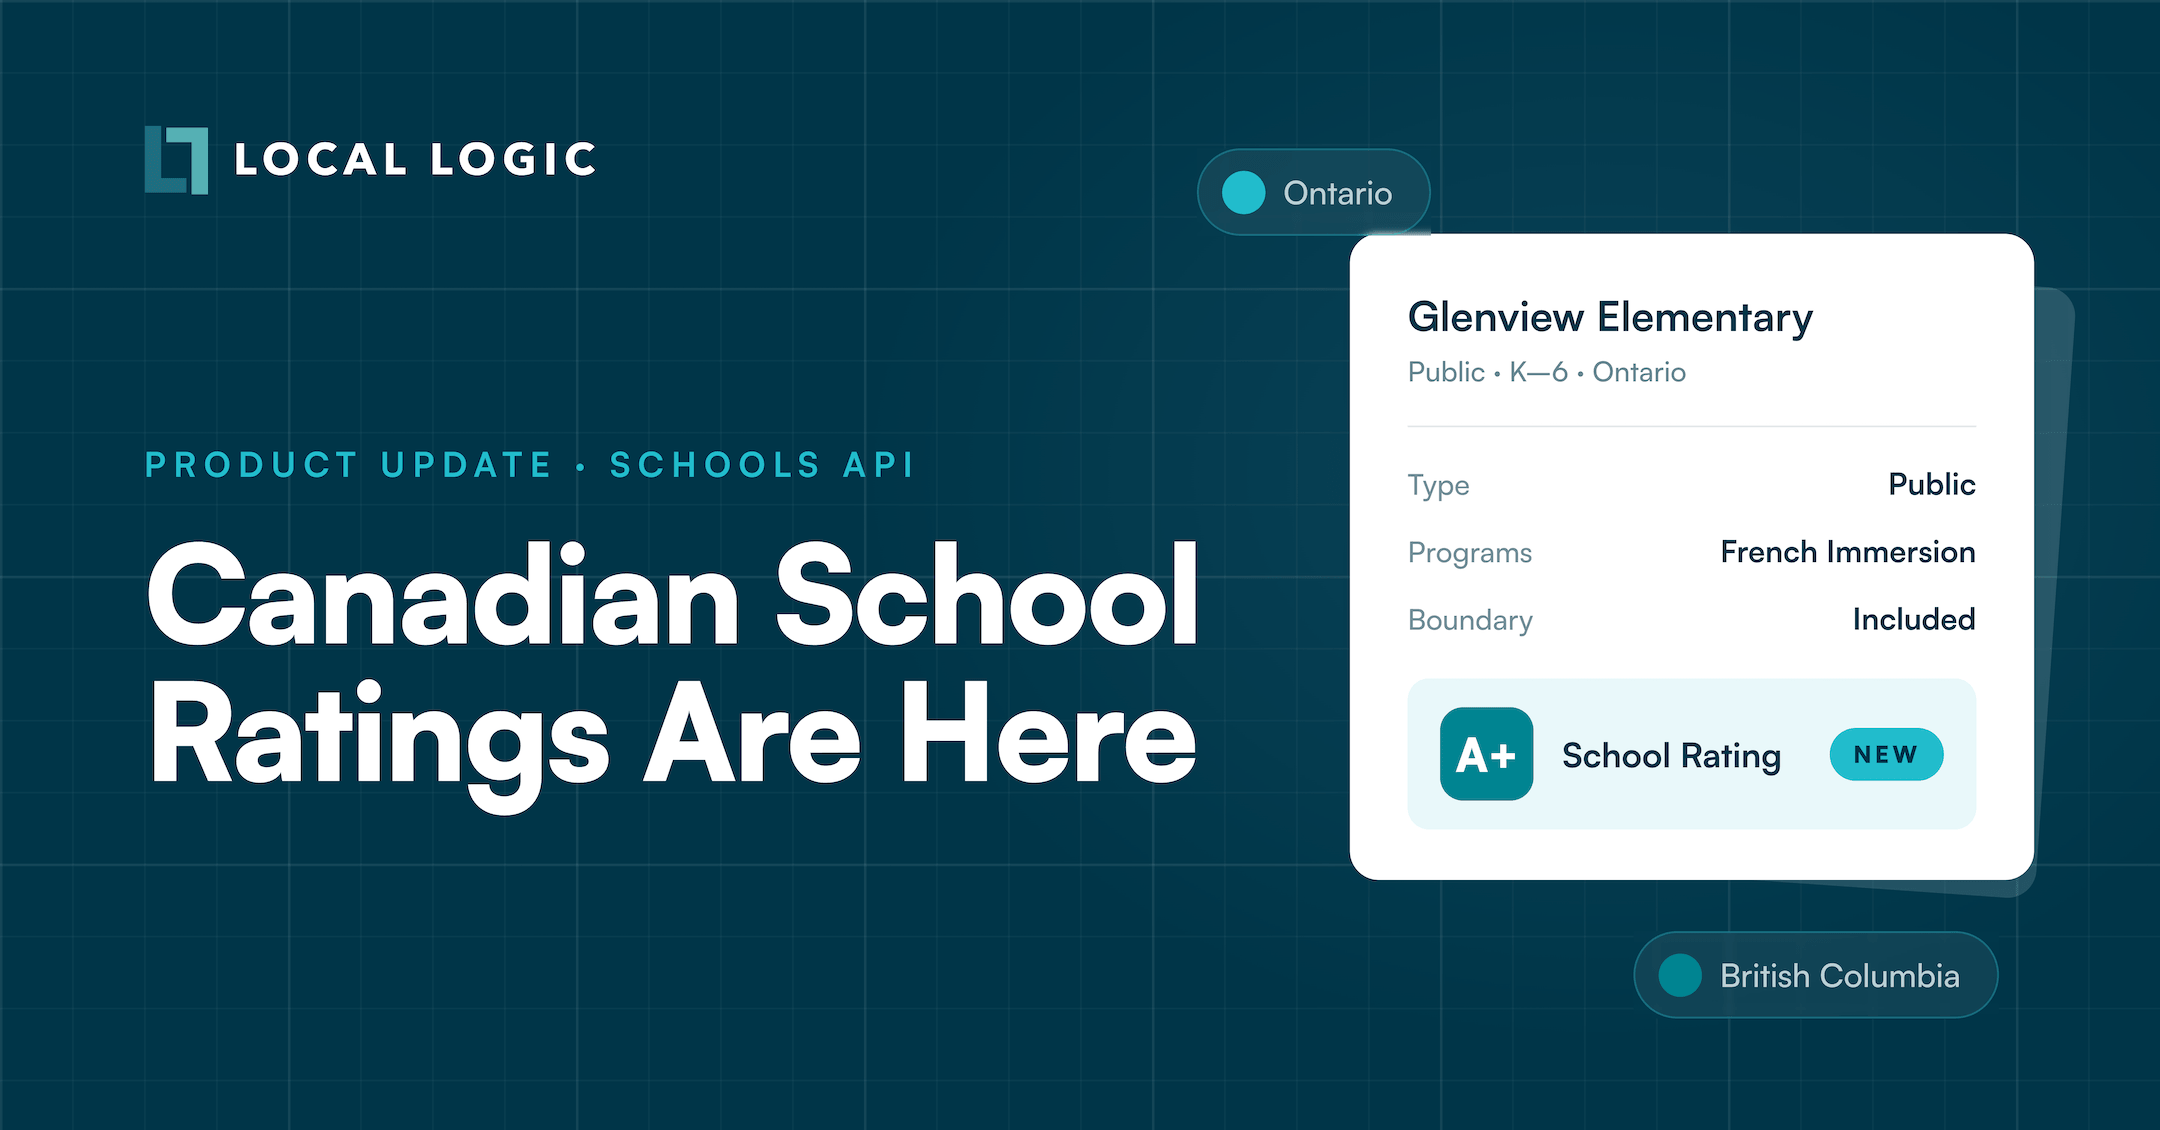
Canadian School Ratings Now in Local Logic’s Schools API
Product
| 09 Jun 2026
The 2026 World Cup is here: 104 matches, 16 stadiums, three countries, and millions of visitors who will spend far more hours outside the stadiums than inside them. The broadcast stops at the touchline. The tournament does not. So we scored the neighborhood around all 13 host venues in the United States and Canada to see what each one is actually like for the people showing up.
The short version: Vancouver Stadium sits in the most walkable, transit-rich district of any host venue, Seattle and Toronto are close behind, and several US stadiums are built for the highway and the tailgate rather than the stroll. None of that makes one better than another. Every venue is good at something, and the data shows what.
TL, DR:
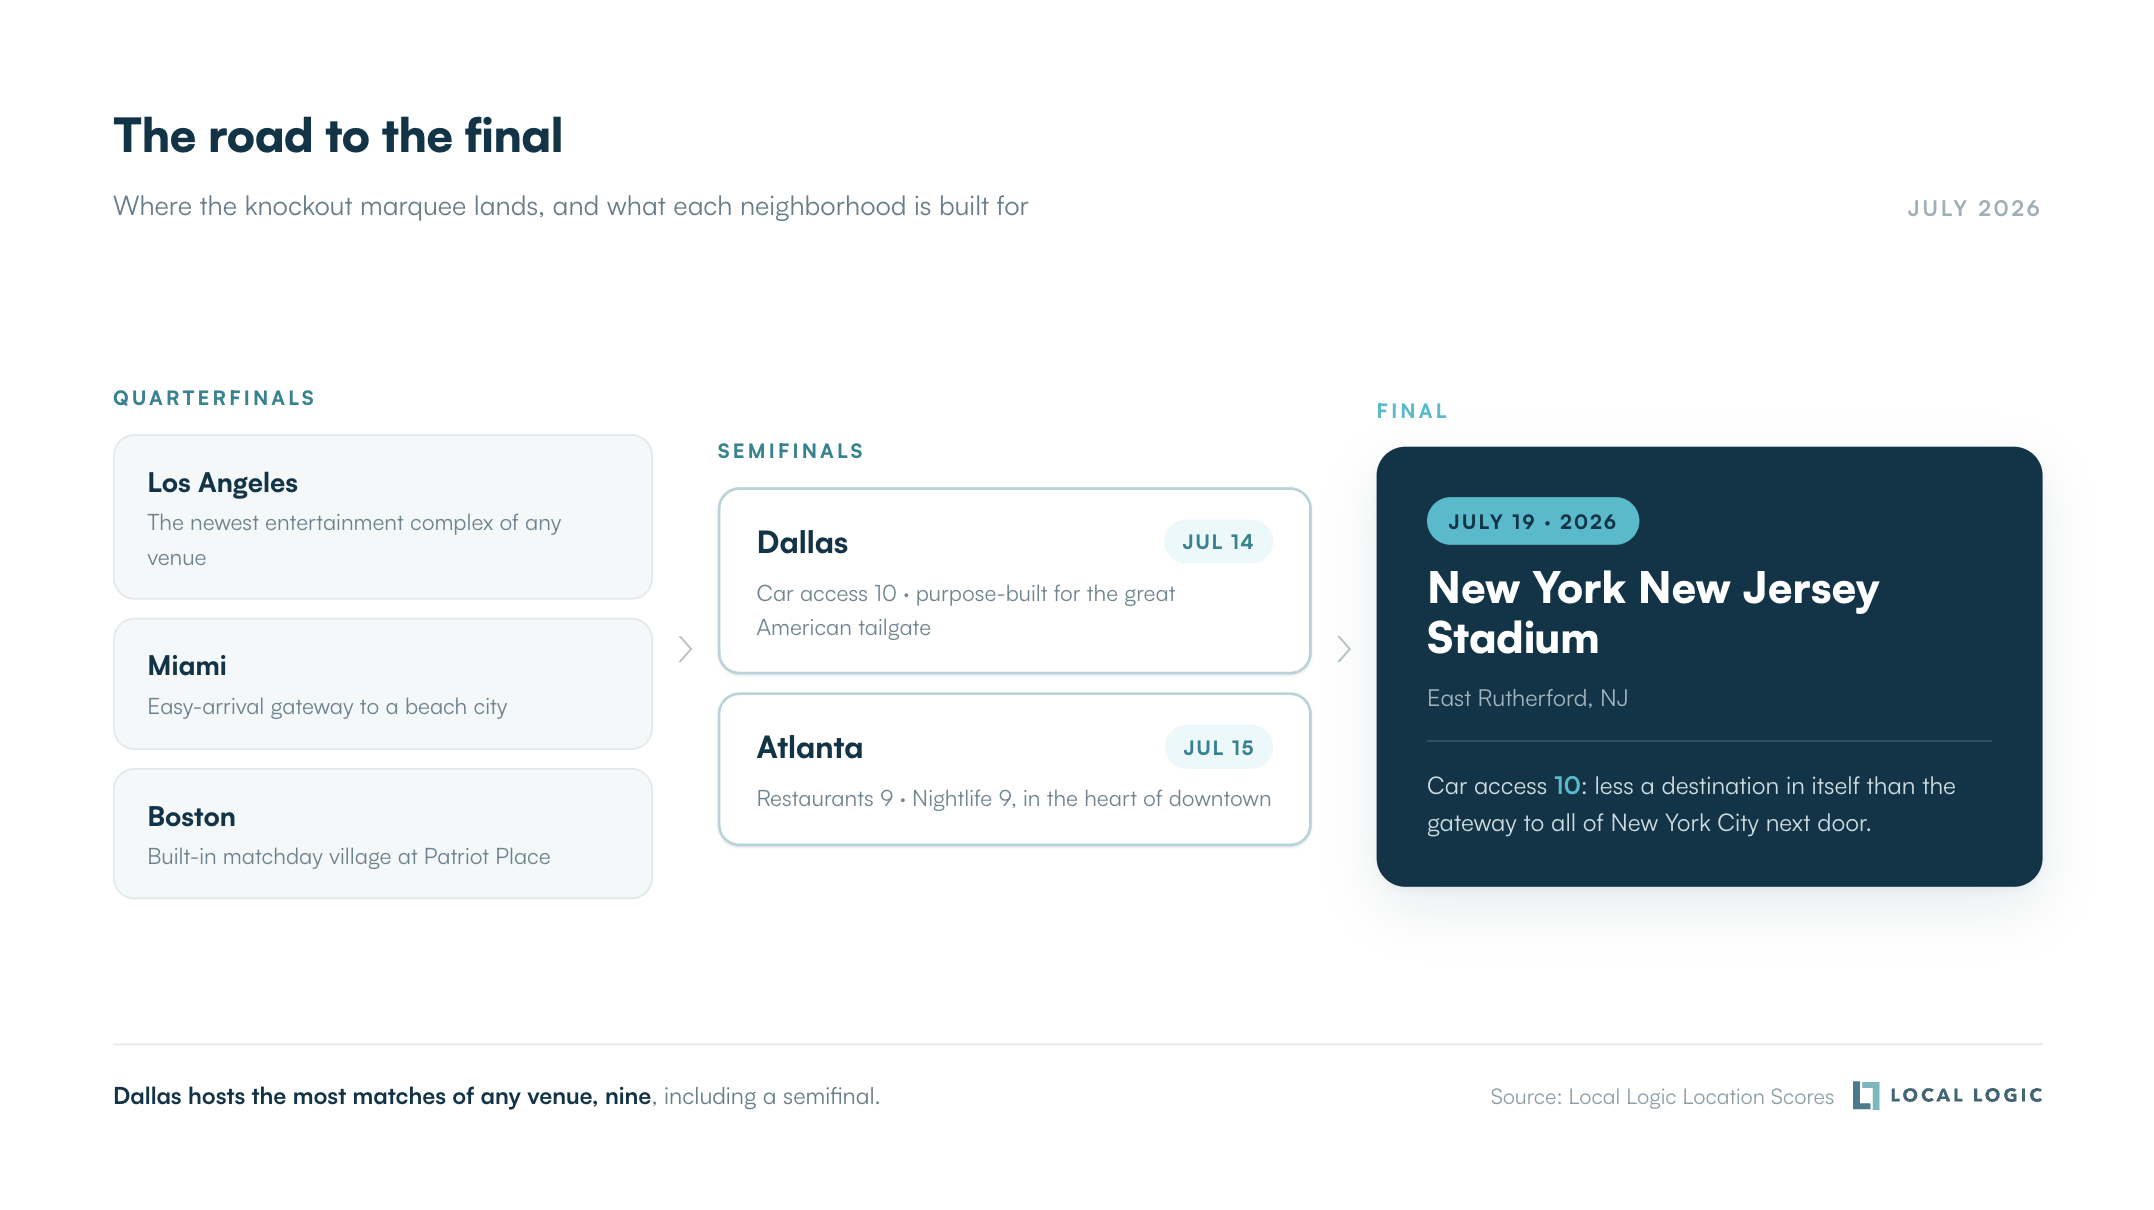
The marquee fixtures are spread across very different kinds of places. The final is at New York New Jersey Stadium in the East Rutherford area on July 19. The two semifinals land in Dallas on July 14 and Atlanta on July 15. The quarterfinals run through Los Angeles, Miami, and Boston.
Each of those venues has a distinct character once you step outside it. New York New Jersey Stadium scores top marks for car access and groceries, and it works less as a destination in itself than as the gateway to all of New York City next door. Dallas Stadium in Arlington hosts more matches than anywhere else in the tournament, nine in total, plus a semifinal, and its strength is the drive-in: easy parking and wide open space, purpose-built for the great American tailgate. Atlanta Stadium, host of the other semifinal, sits in the heart of downtown, where restaurants and nightlife both score 9 out of 10.
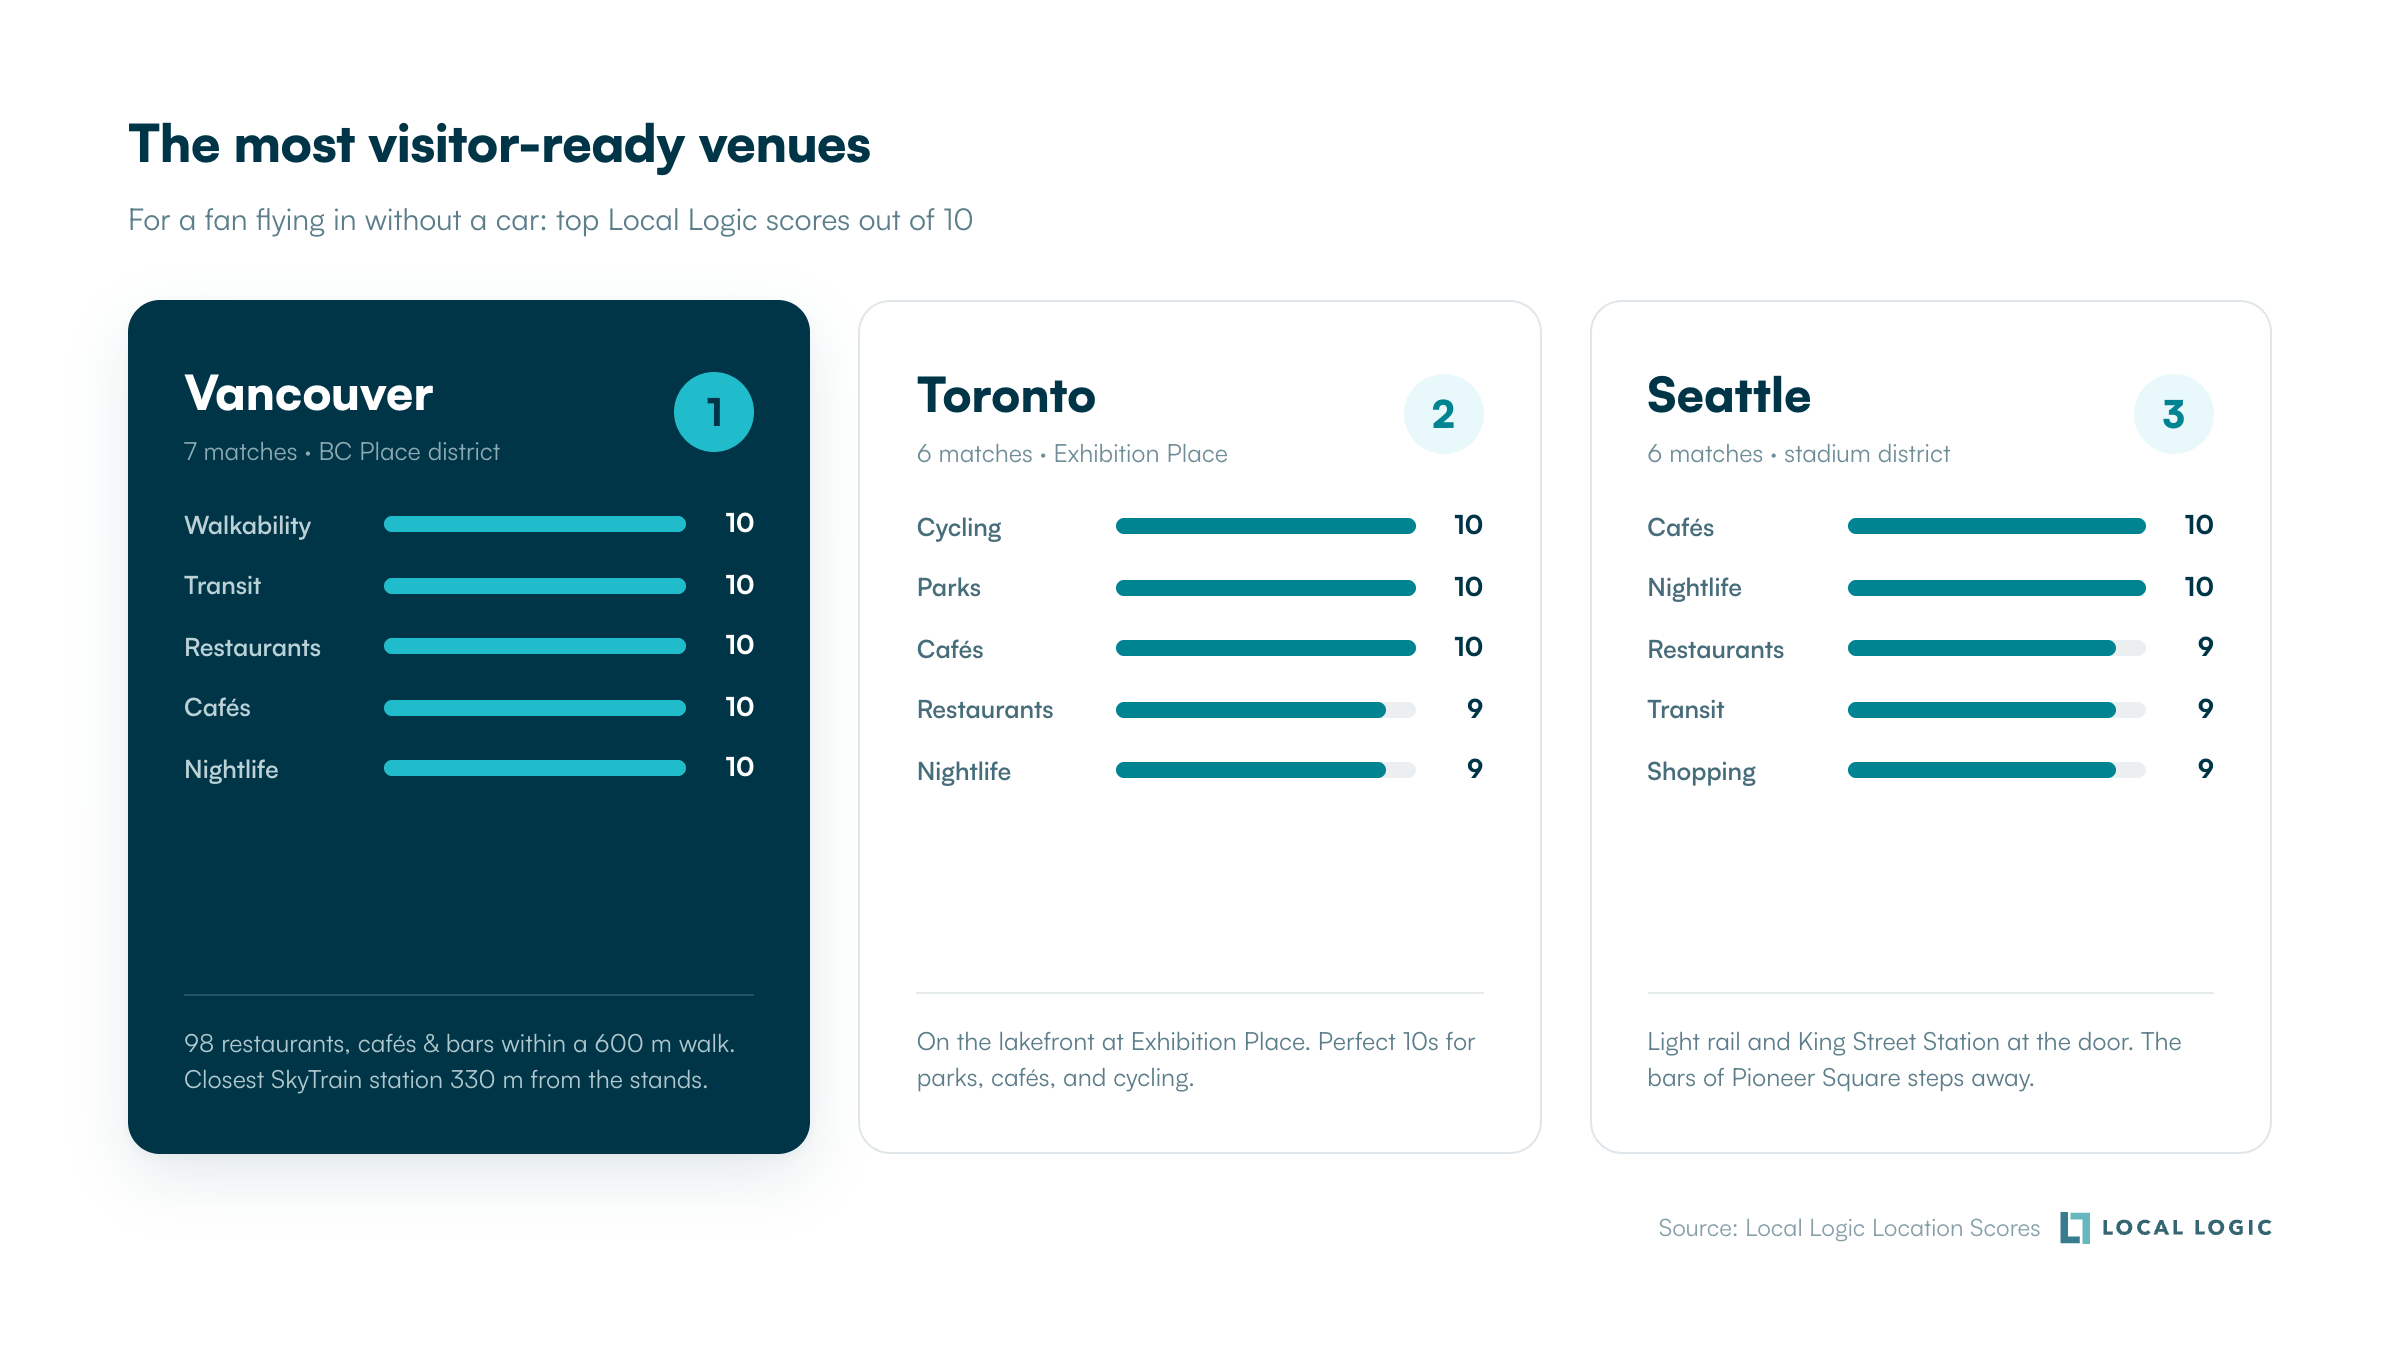
For a fan flying in without a car, Vancouver, Seattle, and Toronto are the easiest places to land. All three put a transit station, a meal, and a place to gather within a short walk of the stadium gate.
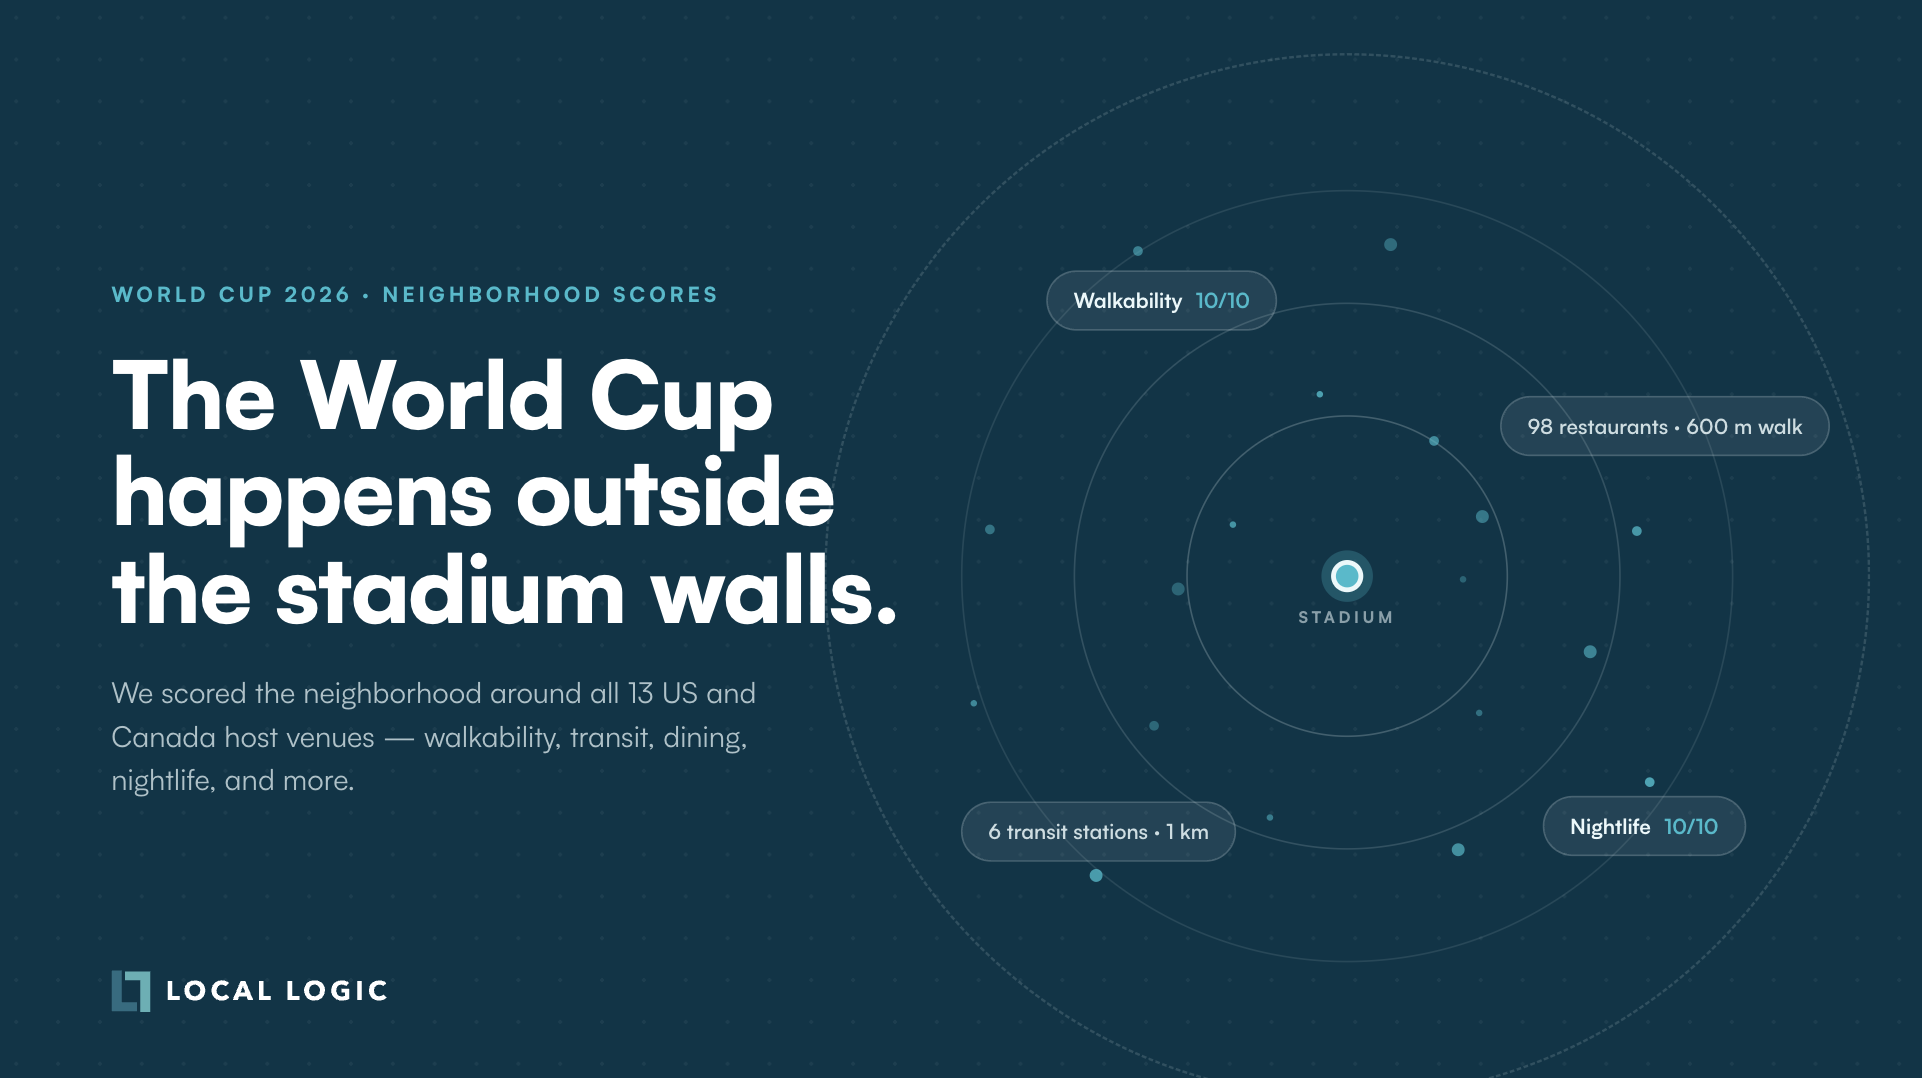
Vancouver Stadium leads every venue in the tournament. It scores a perfect 10 for walkability, transit, and dining, and the points on the ground back that up: 98 restaurants, cafés, and bars within a 600-metre (0.4-mile) walk, and six SkyTrain stations within 1 km (0.6 miles), the closest barely 330 metres (0.2 miles) from the stands. It hosts seven matches. Seattle Stadium, host of six, scores a perfect 10 for both cafés and nightlife, with light rail and King Street Station at the door and the bars of Pioneer Square steps away. Toronto Stadium, also six matches, sits on the lakefront at Exhibition Place and posts perfect 10s for cafés, parks, and cycling.
The point of measuring all this is not to crown a winner. A suburban stadium is not a worse stadium. It is a different one, with its own signature.
Kansas City Stadium is the great tailgate cathedral, the most open and easygoing setting of any venue, and home to the loudest crowd in the NFL. Boston Stadium in Foxborough, MA, comes with a built-in matchday village at Patriot Place, with dining and shops right at the gate. Houston Stadium is the quiet all-rounder, walkable and well-stocked, with a light rail line straight into downtown. Los Angeles brings the newest, most polished entertainment complex of any venue. Miami is the easy-arrival gateway to a beach city. Philadelphia Stadium anchors a four-stadium sports district with a subway line into Center City, and the San Francisco Bay Area Stadium scores 9 for both cycling and parks. Read each one for its strength, and the map stops looking like a ranking and starts looking like 13 different invitations.
Location is the most consequential and least-explained factor in almost any real estate decision, and a World Cup makes that visible at full volume. The same question a traveling fan asks, what is it actually like around here, is the question a home consumer asks on every listing they open.
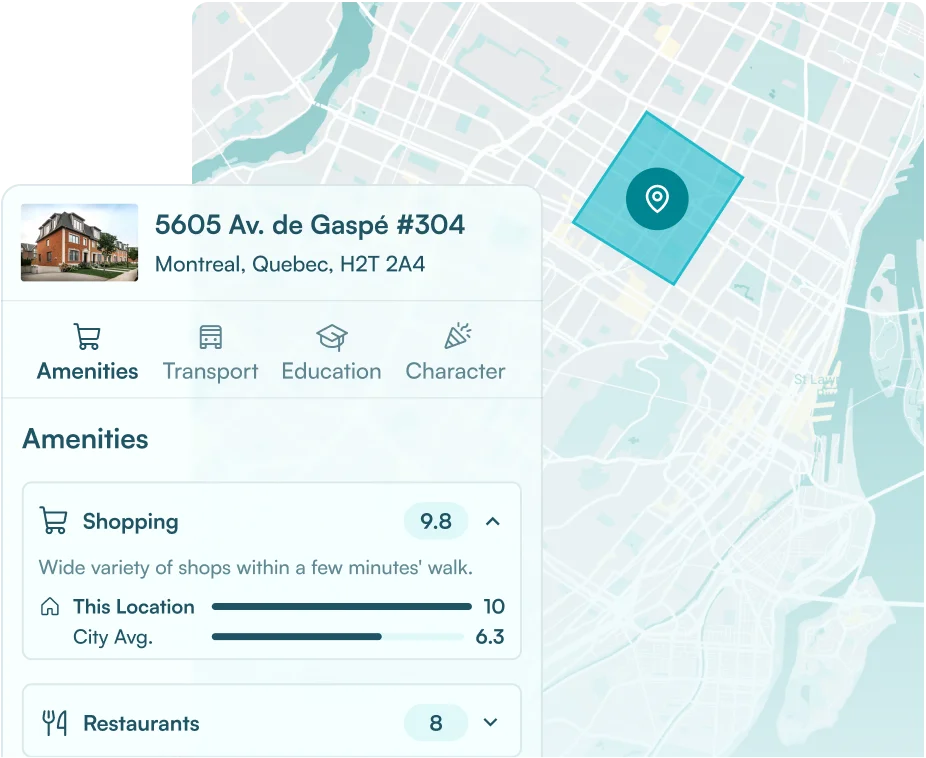
That is what Local Logic measures: everything outside the four walls. For every address in the United States and Canada, we help people understand transit, walkability, dining, green space, schools, and more. The same data that tells a fan where to eat before kickoff tells a buyer what it feels like to live there before they ever visit. The World Cup is a fun proof of a serious idea.
Here is the story told in numbers. Each venue leads with its strongest Local Logic location scores on a 10-point scale, where higher means stronger access. These are real, comparable figures, the kind of trusted data that helps both real estate agents and home consumers understand a place before they ever set foot in it.
Every venue is scored across all 18 Local Logic location scores. Above, we lead with the strengths that define the matchday. The complete breakdown is available for any address in the US and Canada.
A World Cup turns a city inside out for a month. The match is 90 minutes. The trip in, the meal beforehand, and the walk back are the other 23 hours, and they are shaped entirely by what surrounds the stadium. That is the part worth measuring, on matchday, and every other day.
Book a demo to see what Local Logic shows about any address in the US and Canada.
Vancouver Stadium. It scores a perfect 10 for walkability, transit, and dining on Local Logic’s 10-point scale, with 98 restaurants, cafés, and bars within a 600-metre (0.4-mile) walk and six SkyTrain stations within 1 km (0.6 miles). Seattle Stadium and Toronto Stadium rank next.
The final is at New York New Jersey Stadium in East Rutherford, New Jersey, in the New York metropolitan area, on July 19, 2026. The venue scores highest on car access and everyday amenities, and serves as the entry point to New York City.
Dallas Stadium in Arlington, Texas, hosts nine matches, more than any other venue, including a semifinal on July 14. Its surrounding area scores highest of all venues for driving and parking.
It varies widely. Downtown venues like Vancouver, Seattle, Atlanta, and Philadelphia put dozens of restaurants, cafés, and bars within walking distance, while suburban venues like Kansas City, Dallas, and Boston are built around open space, parking, and self-contained complexes such as Patriot Place in Foxborough, MA.
We pulled Local Logic location scores at each stadium’s coordinates on the 10-point scale, covering transit, walkability, dining, nightlife, green space, and more, then confirmed them with counts of nearby restaurants, cafés, bars, and transit stations. The analysis uses objective location data only.