

How VADA® Property Management Keeps Renters Engaged From First Click to Signed Lease
Residential
| 17 Mar 2026
A Local Logic technical whitepaper. Companion to the article “AI is confidently wrong about neighborhoods. We measured it, then fixed it.”
Study conducted July 2026. Statistics are 95% confidence intervals, cluster-bootstrapped over neighborhoods, and we quote the lower bound of the interval rather than the point estimate.
This is the full technical companion to our research on AI accuracy in real estate. For the plain-language overview, read AI is confidently wrong about neighborhoods.
Large language models are now the front door to real estate. Buyers and professionals alike ask them what a neighborhood is like to live in, and the models answer fluently. On the location facts that decide a purchase, they are also frequently and confidently wrong. This paper reports a paired evaluation of seven language models answering the same 490 neighborhood questions twice, once from memory alone and once connected to Local Logic data through the Model Context Protocol (MCP), with every claim fact-checked against live data rather than a pre-written answer key.
Grounding a model in Local Logic data roughly doubled the number of verified facts per answer, cut contradicted claims by about 2 to 4 times per model, and roughly halved the share of answers with multiple serious errors. The largest gains went to the smallest, cheapest models, which is where accuracy is otherwise weakest. A dedicated live-web-search product scored below every grounded model on the same questions, which points to the conclusion the study is built to support: on location, the value is in the data, not in the retrieval.
For readers who want the result before the method.
| Measure | Result with grounding |
|---|---|
| Verified facts per answer | About 1.8x to 2.3x more (up to 2.2x on the strongest models on the product categories) |
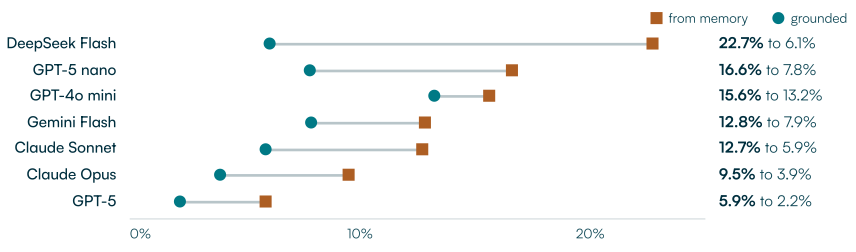
| Claim-level contradicted rate | Down about 2x to 4x per model; one model 22.7% to 6.1% |
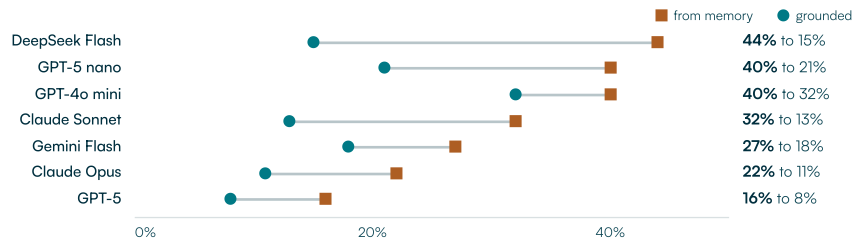
| Answers with 2+ serious errors | Roughly halved on average (about 32% to 17%) |
| Accuracy, grounded models | 89% to 97% claim accuracy on location-dependent categories |
| Cost | Cheap grounded model rivals frontier-from-memory accuracy at a fraction of cost per answer |
| Scale | 7 models, paired; 490 questions; 46 neighborhoods; 7,350 verified answers; 153,530 scored claims |
Location has always been the part of a home decision that the listing cannot describe. Square footage and price are on every website. The commute, the walk to transit, what is a few minutes away, how a street actually lives at different hours: that is what people are choosing, and until recently the only way to get it was to ask a person who knew.
In 2026 a machine started answering that question at scale, for free, with total confidence. The catch is accuracy. A model that has read the whole internet still has no reliable, calibrated, comparable record of what is around a specific address, so it fills the gap the way models do, by generating a plausible answer. For casual browsing that is tolerable. For a decision measured in years and hundreds of thousands of dollars, a confident wrong answer is a liability, and neither the buyer nor the professional relaying the answer can tell which claims to trust.
Grounding is the technique that closes this gap. A grounded model answers from verified external data supplied at the moment of the question rather than from patterns in its training. It looks the fact up instead of recalling it. This paper measures what grounding on Local Logic data does to a model’s answers about neighborhoods, across the full range of model sizes and prices a team might actually deploy.
The study was pre-registered before the run. The questions, in plain terms:
Paired A/B design. Each model answered the identical question twice: once from its training data alone (the ungrounded arm), and once with access to the Local Logic MCP tools (the grounded arm). Seven paired models span frontier to cheap: GPT-5, GPT-5 nano, Claude Opus, Claude Sonnet, Gemini Flash, GPT-4o mini, and DeepSeek Flash. Running the same model on the same question with tools on and off isolates the effect of the data from the effect of the model. The ungrounded arm used a direct prompt with no hedging instruction, which is deployment-realistic and was committed to before any results existed. Runs were single-shot, with no retries or self-consistency voting.
Benchmark. 490 questions across 46 neighborhoods in 39 cities, sampled along a continuous fame axis (log Wikipedia pageviews) so results are not dominated by famous places. Roughly 20% of neighborhoods are Canadian. Market and affordability questions are US-only by design, because that market data is US-only, and this is disclosed rather than papered over.
Scoring: claims fact-checked against live data, not an answer key. A frozen claim-verification judge (a model with access to the Local Logic MCP and web search, temperature 0, locked before the run) breaks each answer into atomic claims and checks each one against live data: our data for the categories we cover, web search to backfill the rest. This is deliberately stronger than grading against a pre-written gold answer, because the accuracy numbers then rest on whether each stated fact actually checks out, not on any model’s opinion. Scoring is tiered:
Metrics. Three headline measures. Verified-fact volume is the count of supported claims per answer, reported as the grounded-to-ungrounded ratio; it is a coverage measure, not a correctness measure. Claim verification rate is supported divided by supported-plus-contradicted, reported as the accuracy percentage, with unverifiable claims reported separately and never counted in the denominator. Hallucination is the claim-level contradicted rate, with a secondary “materially wrong” measure counting answers with two or more central contradicted claims.
Statistics and targets. Every figure is a 95% confidence interval, cluster-bootstrapped over neighborhoods, because questions within a neighborhood are correlated and naive per-question intervals would be too tight. We quote the lower bound of the interval, so a claim strengthens rather than collapses under scrutiny. Pass and fail bars were fixed before the run: verified-fact volume lift at least 1.5x, deterministic accuracy at least 90%, synthesis accuracy at least 95%, and a no-harm margin within 0.7 points.
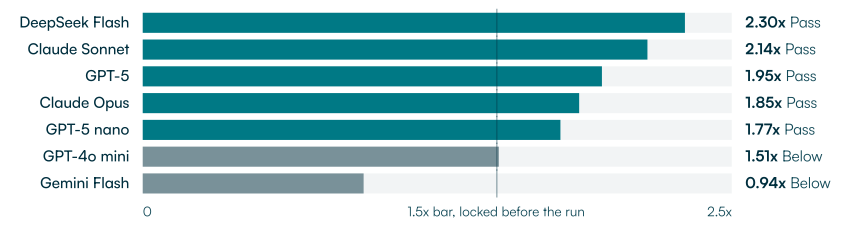
Grounded answers carried more true, checkable facts. Pooling across categories and comparing each grounded arm to its own ungrounded arm, five of seven models cleared the 1.5x bar on the lower bound of the interval.
| Model | Volume lift (CI lower bound) | Verdict |
|---|---|---|
| DeepSeek Flash | 2.30x (2.21x) | Pass |
| Claude Sonnet | 2.14x (2.06x) | Pass |
| GPT-5 | 1.95x (1.89x) | Pass |
| Claude Opus | 1.85x (1.80x) | Pass |
| GPT-5 nano | 1.77x (1.70x) | Pass |
| GPT-4o mini | 1.51x (1.42x) | Below bar |
| Gemini Flash | 0.94x (0.89x) | Below bar |
The two that fall short are informative rather than disappointing. Both are among the terser models: they emit fewer claims overall, so a volume ratio can sit near or below 1.0 even as the accuracy of what they do say improves. Volume is a coverage measure, and it should be read alongside accuracy, not on its own.
Grounded models reached high claim accuracy on both the deterministic and synthesis tiers. Bars were 90% deterministic and 95% synthesis.
| Grounded model | Deterministic (CI-LB) | Synthesis (CI-LB) |
|---|---|---|
| GPT-5 | 0.968 (0.955) | 0.988 (0.981) |
| Claude Opus | 0.944 (0.937) | 0.973 (0.966) |
| Claude Sonnet | 0.929 (0.906) | 0.970 (0.953) |
| DeepSeek Flash | 0.929 (0.916) | 0.967 (0.961) |
| GPT-5 nano | 0.909 (0.895) | 0.962 (0.953) |
| Gemini Flash | 0.902 (0.864) | 0.931 (0.899) |
| GPT-4o mini | 0.852 (0.813) | 0.908 (0.871) |
Most grounded models clear both bars. The two cheapest general-purpose models (Gemini Flash, GPT-4o mini) fall short of the strict synthesis bar on the lower bound, which is consistent with the pattern throughout: grounding lifts every model, and the weakest models, while improving the most in absolute terms, still trail the strongest.
The claim-level contradicted rate on the location-dependent categories fell for every model when grounded.
| Model | Contradicted, from memory | Contradicted, grounded | Reduction |
|---|---|---|---|
| DeepSeek Flash | 22.7% | 6.1% | 3.7x |
| GPT-5 nano | 16.6% | 7.8% | 2.1x |
| GPT-4o mini | 15.6% | 13.2% | 1.2x |
| Gemini Flash | 12.8% | 7.9% | 1.6x |
| Claude Sonnet | 12.7% | 5.9% | 2.1x |
| Claude Opus | 9.5% | 3.9% | 2.5x |
| GPT-5 | 5.9% | 2.2% | 2.7x |
Counted per answer rather than per claim, the share of answers with two or more serious errors roughly halved: about 32% of ungrounded answers were materially wrong, against about 17% grounded.
A note on how this is reported. One pre-registered gate for the hallucination measure required both a high absolute rate and at least a 3x reduction; that gate was retired before analysis because its 3x multiplier assumed grounded rates in the low single digits, which the data did not support. Grounding roughly halves hallucination, which is real and reported here as a measured reduction rather than as a threshold pass. We disclose the retired gate rather than drop it.
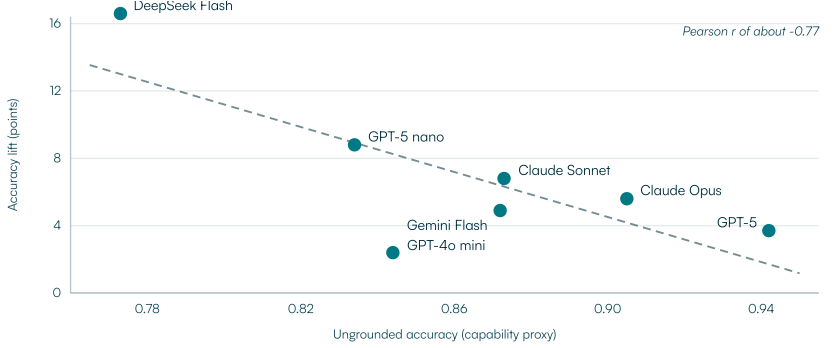
Accuracy lift is inversely related to a model’s standalone capability. Using each model’s ungrounded accuracy as a capability proxy, the correlation between capability and accuracy lift is strongly negative (Pearson r of about -0.77). The weaker a model is on its own, the more grounding helps.
| Model | Ungrounded baseline | Accuracy lift (points) |
|---|---|---|
| DeepSeek Flash | 0.773 | +16.6 |
| GPT-5 nano | 0.834 | +8.8 |
| Claude Sonnet | 0.873 | +6.8 |
| Claude Opus | 0.905 | +5.6 |
| Gemini Flash | 0.872 | +4.9 |
| GPT-5 | 0.942 | +3.7 |
| GPT-4o mini | 0.844 | +2.4 |
The trend is directional rather than a passed statistical gate: with only seven models, the slope’s confidence interval still crosses zero. The descriptive signal is clear and consistent with the mechanism, so we report it as directional support, not as proof.
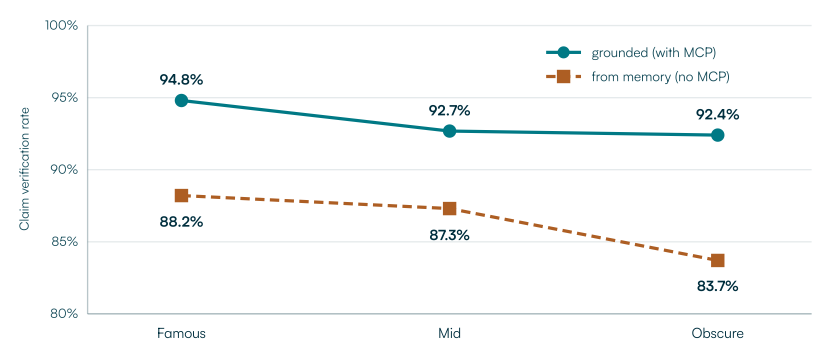
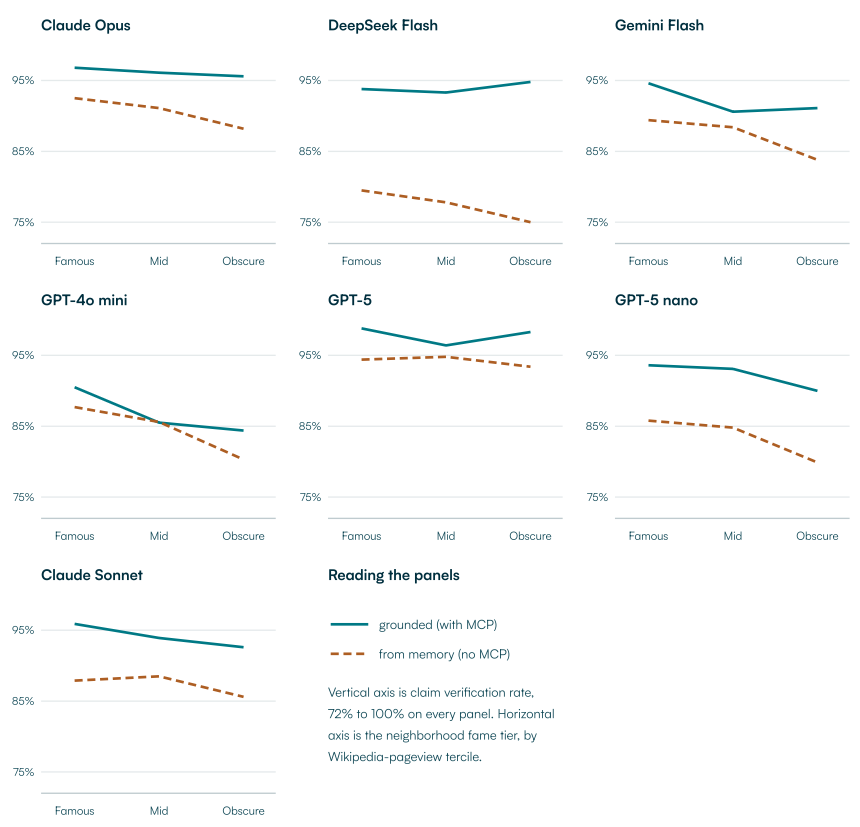
Ungrounded accuracy depends on fame. Models know famous neighborhoods and guess on obscure ones, so accuracy from memory slides as a place gets less known. Grounded accuracy stays flat, because the data is retrieved regardless of fame.
| Fame tier | Accuracy from memory | Accuracy grounded | Volume lift |
|---|---|---|---|
| Famous | 88.2% | 94.8% | 1.90x |
| Mid | 87.3% | 92.7% | 1.88x |
| Obscure | 83.7% | 92.4% | 1.93x |
This matters commercially because volume is not concentrated in famous places. A large share of transactions happen in the long tail of lesser-known neighborhoods, which is exactly where ungrounded models are least reliable and where grounding’s edge is largest.
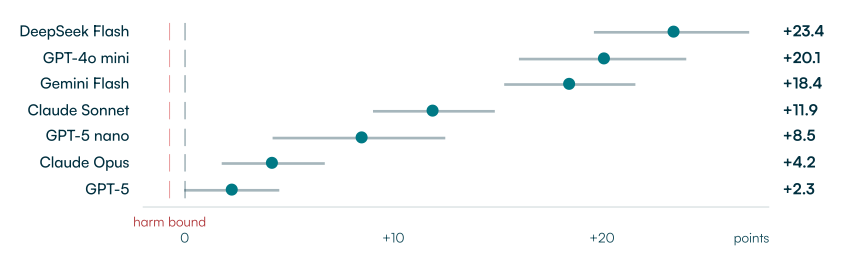
Grounding did not degrade answers on the public-fact categories that models already handle well. On the entity tier (transit, parks, schools, points of interest), the grounded-minus-ungrounded difference was positive for every model, from about +2 to +23 points, comfortably clearing the no-harm margin. Adding the tools helped even here, and never hurt. This is reported as a proxy for the pre-registered no-harm test, which used a separate public-fact set that was deferred from this run.
This is the finding that reorders budgets. Grounding lifts every model, and it lifts the cheap ones so much that they approach frontier accuracy at a fraction of the price.
| Grounded model | Location-dependent accuracy (CI-LB) | Cost per answer |
|---|---|---|
| GPT-5 | 0.978 (0.963) | $0.535 |
| Claude Opus | 0.961 (0.954) | $0.517 |
| Claude Sonnet | 0.941 (0.910) | $0.074 |
| DeepSeek Flash | 0.939 (0.921) | $0.010 |
| GPT-5 nano | 0.922 (0.906) | $0.004 |
| Gemini Flash | 0.921 (0.879) | $0.006 |
| GPT-4o mini | 0.868 (0.829) | $0.004 |
Read against the best frontier-from-memory baseline (GPT-5 at 0.942 on the location-dependent categories), the strict non-inferiority test is cleared on the lower bound only by the two expensive grounded models. The cheaper grounded models land within a few points of that frontier baseline at one-third to one-twentieth of the cost per answer, a trade most teams running at volume will take.
On the categories exposed in the product today (setting aside climate and affordability, which are measured in the study but not yet placed in front of AI), the picture is sharper still: a grounded GPT-5 nano reached 97.6% and edged out full GPT-5’s own 96.9%, at roughly one-seventh the cost per answer. The takeaway is the same at both cuts of the data: you do not need the biggest model, you need the right data feeding it.
Accuracy and cost per answer for each model are shown in the table above.
To answer the obvious objection, why not just let the model search the web, the study included a dedicated live-search product as a control. It scored 82% on the location-dependent categories, below every one of the seven grounded models (the weakest grounded model was 87%), at a cost per answer higher than most of the grounded cheap models. Retrieval by itself does not reach a calibrated, comparable location answer, because that answer is not sitting on a page to be found. The moat is the dataset, not the search.
The aggregate rates are easier to feel through specific errors. Every example below came from an ungrounded model in the study and was contradicted by live data. They fall into three recognizable failure modes, and none of them hedged. Each read like local expertise, which is exactly why the error is dangerous: the person receiving it has no signal that it is wrong.
Two things connect these. First, they cluster on exactly the categories the study flagged: transit, points of interest, schools, commute, walkability, character, and similarity. Second, none of them are hedged. The model states the invented station or the wrong commute with the same confidence it states a correct fact, which is precisely why a reader cannot tell the difference without the data behind it.
Models are closing the gap on almost everything. Location is different for three structural reasons, and the results above trace directly to them.
The four walls of a home are on every website. Everything outside them, measured, calibrated, and comparable, is the part no model and no crawl reproduces on its own.
Reported in brief; the full pre-registration and methodology notes are available on request.
The practical conclusion is short. If you are putting AI in front of anyone making a location decision, the accuracy of the location layer is a product risk, and it is one you can remove. Grounding a model in verified location data is the lever, and the study shows it works across the full range of models, with the largest gains on the smallest and cheapest ones. That last point is the one to sit with: grounding is not only how you make the answer trustworthy, it is how you make a trustworthy answer affordable at scale.
The Local Logic MCP is how a model connects to that data. It exposes our verified location data as tools any MCP-capable model can call at the moment of the question, which is the exact configuration measured in this paper.
Questions by category (490 total). affordability 90, commute 75, character 60, livability 45, demographics 45, climate 45, similar 24, comparative 24, transit 21, parks 21, points of interest 20, schools 20.
Scoring tiers. Deterministic: livability, climate, affordability, commute, demographics. Entity: transit, parks, schools, points of interest. Synthesis: character, comparative, similar.
Coverage. 46 neighborhoods across 39 cities, split roughly evenly across famous, mid, and obscure tiers by Wikipedia-pageview tercile, from high-traffic neighborhoods such as Williamsburg in Brooklyn and Silver Lake in Los Angeles to lesser-known ones such as Butchertown in Louisville and Bay View in Milwaukee. Roughly 20% are Canadian.
Scale. 7 paired models, 7,350 verified answers, 153,530 scored claims.
Cost per answer, from memory and grounded, with average tool calls in the grounded arm.
| Model | Cost, from memory | Cost, grounded | Avg tool calls (grounded) |
|---|---|---|---|
| GPT-5 | $0.0289 | $0.5354 | 4.7 |
| Claude Opus | $0.0581 | $0.5174 | 4.0 |
| Claude Sonnet | $0.0059 | $0.0736 | 2.8 |
| DeepSeek Flash | $0.0002 | $0.0098 | 5.8 |
| Gemini Flash | $0.0007 | $0.0063 | 1.8 |
| GPT-5 nano | $0.0014 | $0.0039 | 3.7 |
| GPT-4o mini | $0.0002 | $0.0040 | 1.8 |
| Perplexity Sonar Pro (live search control) | n/a | $0.0160 | n/a |
Non-answer rates (refusals or retrieval-error stubs, reported separately and not graded) were low across arms, with one cheap grounded model the notable exception at about 8%.
This paper reports objective, measured attributes only. Demographic accuracy is treated strictly as a data-verification metric, not as a basis for characterizing who lives anywhere. All figures are from Local Logic’s July 2026 evaluation described above.
Grounding means answering from verified external data supplied at the moment of the question, rather than from patterns in training. A grounded model looks a fact up instead of recalling it.
In this study, connecting models to Local Logic data cut the claim-level contradicted rate by about 2 to 4 times per model, and roughly halved answers with two or more serious errors, from about 32% to 17%.
Yes. Accuracy lift was inversely related to the model standalone capability. The weakest model gained 16.6 points, and a grounded GPT-5 nano reached 97.6% on the product categories at roughly one-seventh the cost of full GPT-5.
No. A dedicated live web-search product scored 82% on the location-dependent categories, below every one of the seven grounded models. A calibrated, comparable location answer is not sitting on a page to be found.
The Local Logic MCP is a hosted server that exposes verified location data as read-only tools any MCP-capable model can call during an answer, which is the exact configuration measured in this paper.
Seven models each answered the same 490 neighborhood questions twice, once from memory and once grounded on the Local Logic MCP, with every claim fact-checked against live data. Every figure is reported at the lower bound of a 95% confidence interval.
The Local Logic MCP is how a model connects to this data in production. Explore the MCP solution page, browse the use case library, read the technical docs, or book a proof of concept.