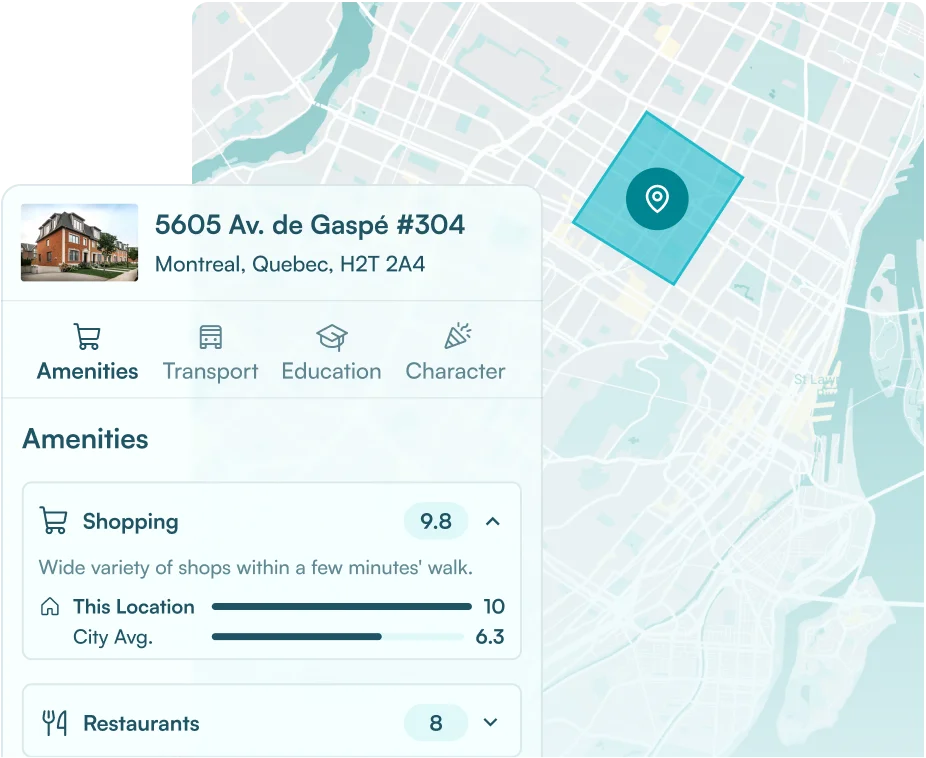



How Are Location Scores Calculated?
Local Logic’s location scores are built by a team with backgrounds in urban planning and data science, using thousands of input datasets. That urban planning grounding is what tells the team which ingredients to measure to capture the experiential qualities of a place, the things people sense about a location but rarely put into words. Each score rates one specific characteristic, such as transit access or how quiet a street is, on a 0 to 10 scale.
Most scores are built on a measure of access: the model finds every relevant destination within a point’s travel time, sums their values, and discounts each one by its distance. The scores are calculated at a fine, address-level resolution, then can be aggregated or summarized at broader levels, such as neighborhoods, when needed. This lets Local Logic preserve block-by-block precision while also supporting neighborhood-level products and reports.
Why location scores exist
People have always known that some locations are worth more than others. The hard part is saying why. A three-bedroom home is clearly worth more than a two-bedroom one, but it is not obvious why a house on one street is worth more than a near-identical house two streets south.
Location resists easy measurement for a few reasons. It is many things at once: distance to amenities, transportation options, noise, the look of the street. It involves trade-offs, because living near a highway is convenient if you drive often and noisier if you do not. And the experience of a place is hard to put into words. Walk down two commercial streets in two cities, and you will probably prefer one, without being able to explain exactly why.
Local Logic built its location scores to quantify what seems unquantifiable. The goal was a consistent, objective way to rate a place across the dimensions that actually shape daily life.
What is a location score?
A location score is a numerical rating from 0 to 10 for one specific characteristic of a place. There is no single combined number, because not everyone values the same things. A household that cycles everywhere and a household that drives everywhere may want opposite things from a street, so each characteristic gets its own score.
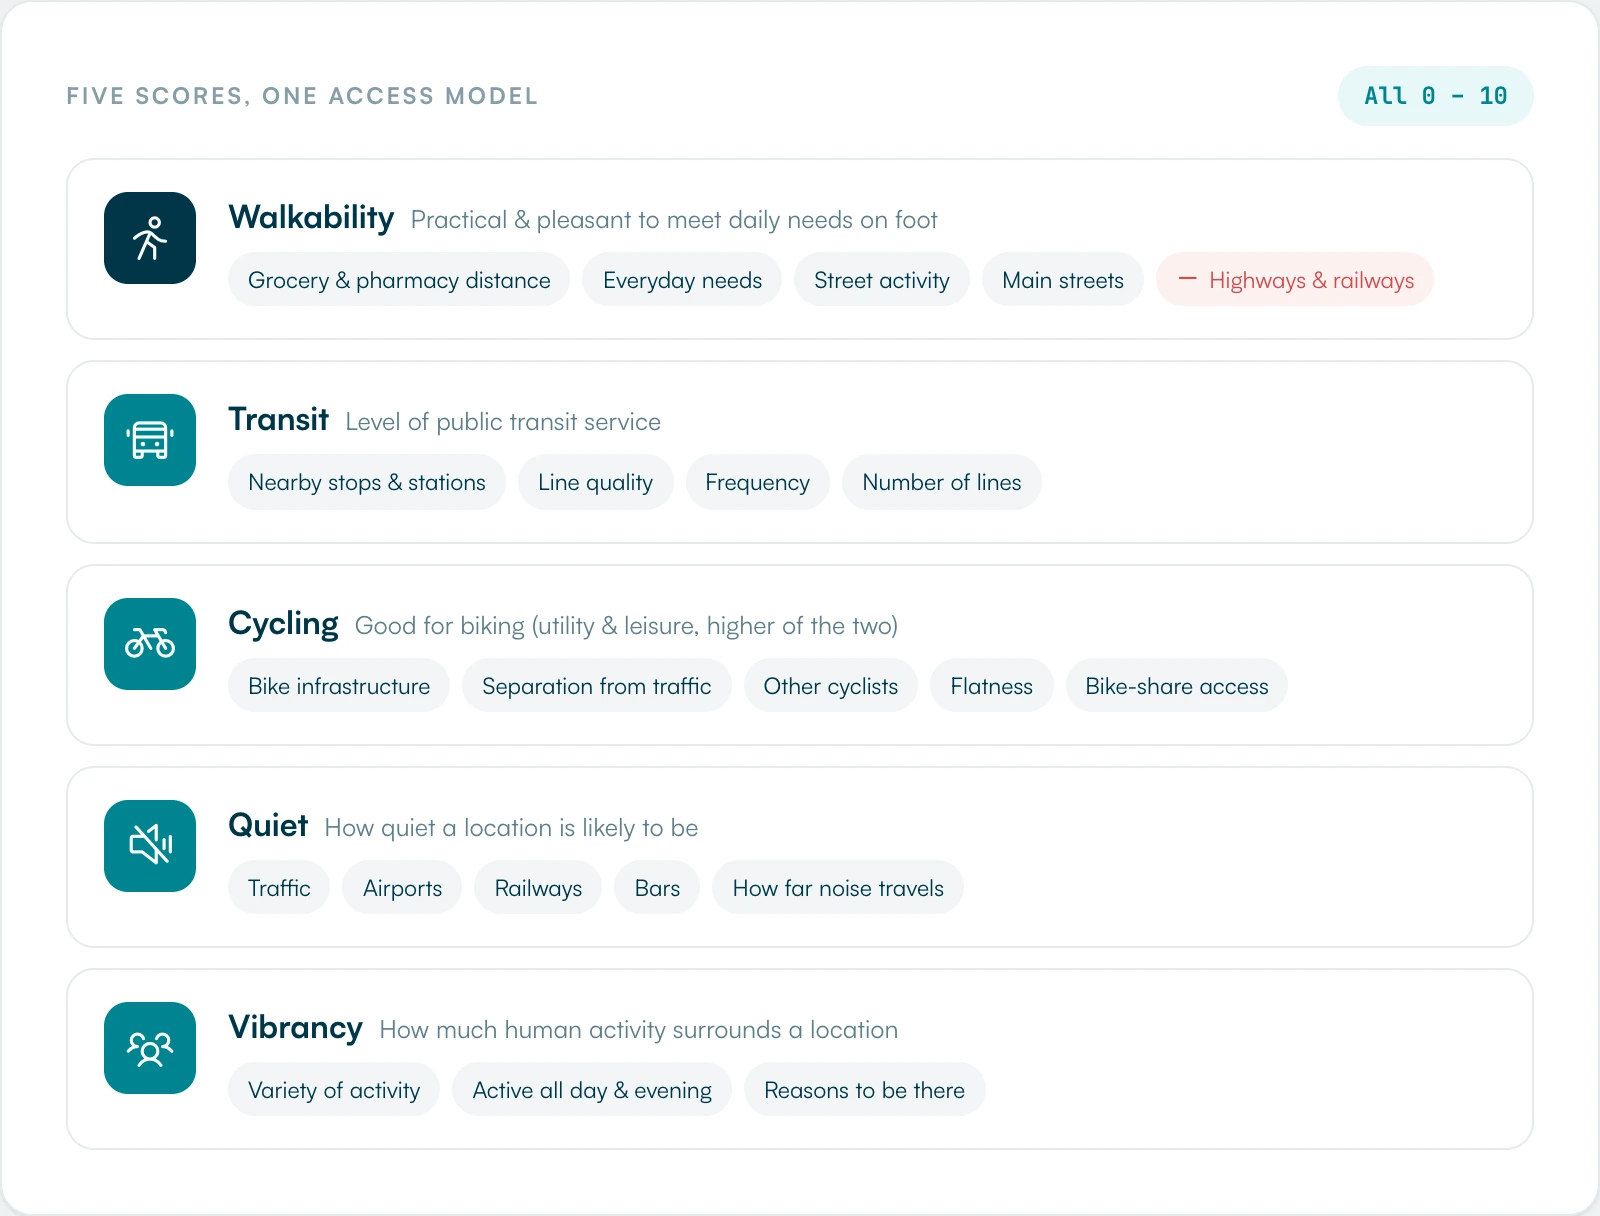
The scores fall into six groupings:
- Transportation: how you get around, including pedestrian-friendly, cycling-friendly, transit-friendly, and car-friendly.
- Amenities: what you can reach day to day, including groceries, shopping, cafes, restaurants, and nightlife.
- Education: the learning options nearby, including primary schools, high schools, and daycares.
- Character: what a place feels like, including quiet, historic, and vibrant.
- Nature: the green side of a place, including parks and greenery.
- Wellness: access to fitness and health-supporting amenities.
There are 18 scores in total. Each score is built on a foundation of thousands of input datasets and developed by data scientists with backgrounds in urban planning.
The core idea: access
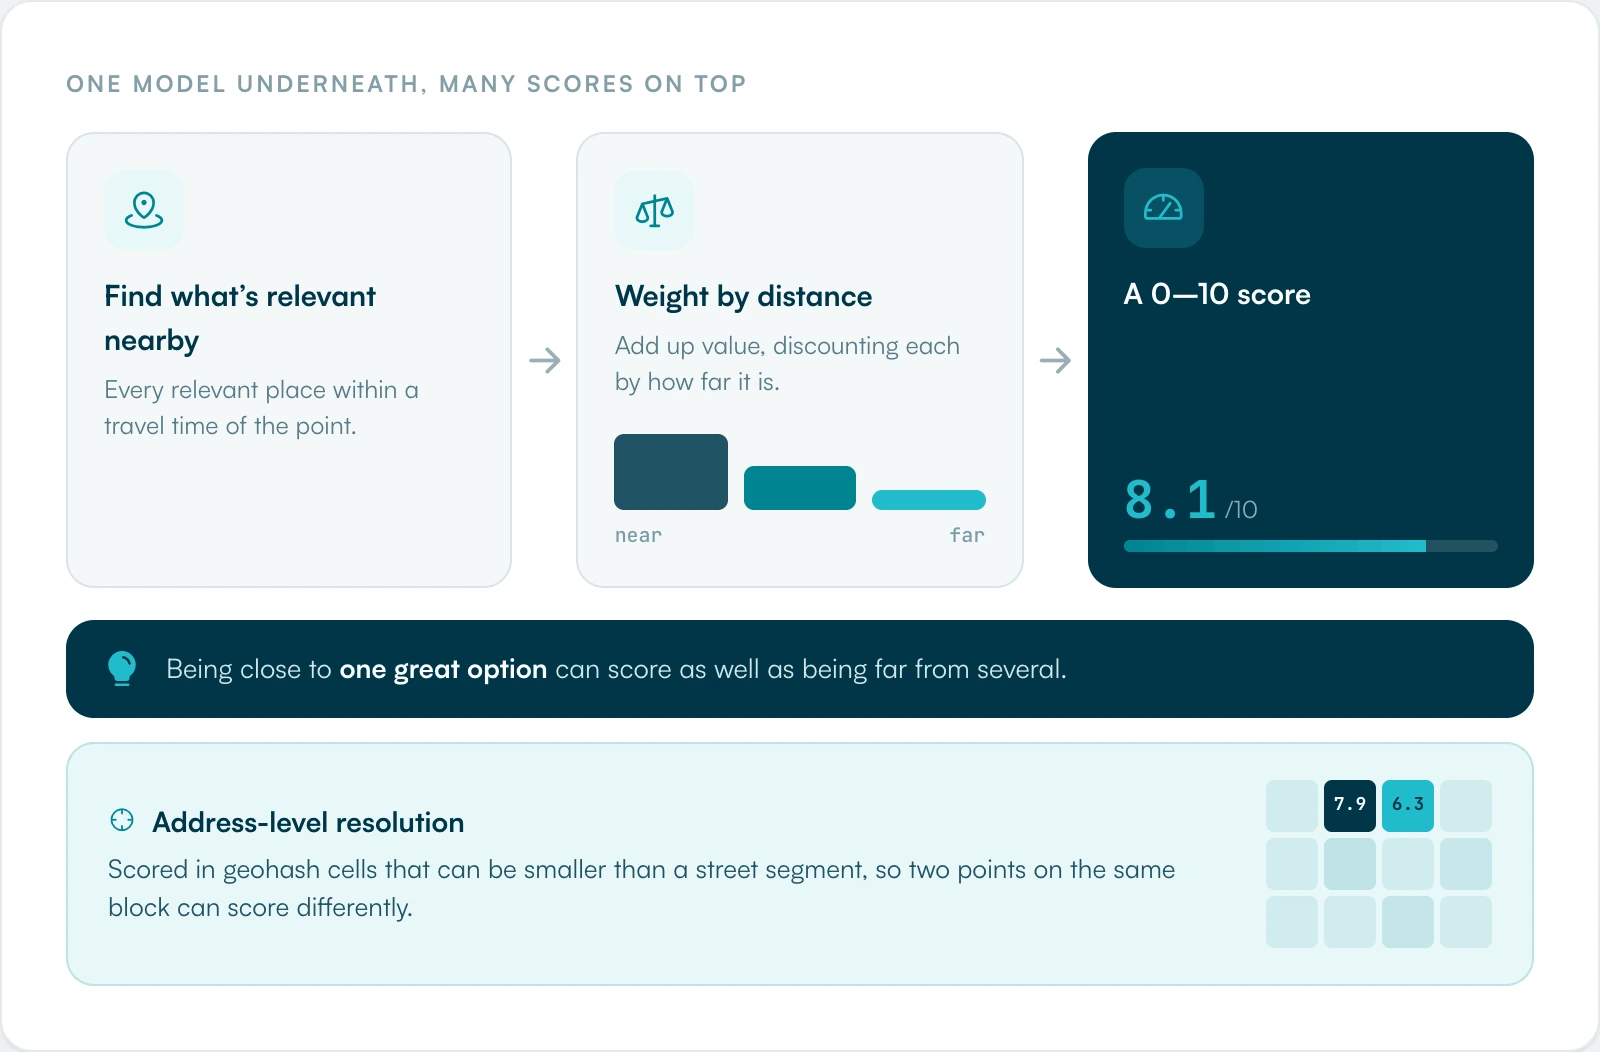
Most location scores rest on one concept: access. To measure access to a type of destination, the model finds every instance within a travel time of the target point, then adds up the value of each one, discounting it by how far away it is. Being close to a single good option can score as well as being far from several. The value of each destination can reflect quality, frequency, or size, depending on the score.
A simple version, where every destination counts the same and value drops with distance, looks like this. With points two, three, and five kilometres away, access equals (1 divided by 2) plus (1 divided by 3) plus (1 divided by 5), which is 1.03.
Now, weight each destination by size. With parks of 1, 4, and 10 hectares at two, three, and five kilometres, access equals (1 divided by 2) plus (4 divided by 3) plus (10 divided by 5), which is 3.83. The large, slightly farther park contributes more than the small, close one, which matches how people actually use parks.
Linear access versus gravity access
There are two ways to apply the distance discount. With linear access, value drops in proportion to distance: at two kilometres, a destination is worth half what it is at one. With gravity access, value drops with the square of distance: at two kilometres, it is worth a quarter.
Both are useful. Linear access spreads the effect out, creating a more diffuse picture. Gravity access drops off sharply, so the result pinpoints exactly where the destinations are. Local Logic uses the approach that best fits what a given score is meant to capture.
Why resolution matters
This is where the method departs from most of the field. Many providers start by scoring at the neighborhood level, which can be useful for a high-level view but often hides real differences, because one neighborhood can vary a lot from block to block. Local Logic takes a different approach: it first computes scores at a much finer resolution, then rolls those scores up to neighborhoods when a broader view is useful. That means neighborhood-level insights are grounded in precise, block-level data rather than broad assumptions about an area.
Local Logic computes its scores at a much finer resolution, down to small geohash cells (a fine grid of location squares) that can be smaller than a single street segment, roughly the footprint of an individual building in a dense area. At that resolution, two points on the same block can score differently, so a calm residential stretch and the busy commercial corner around it are not blurred into one number. The result is a precise picture of what it is like to be at a specific spot, and a stronger foundation for neighborhood-level insights because broader summaries are built from granular location data.
How a few of the scores work
The access model is the engine, but each score applies it to the right inputs.
Pedestrian-friendly
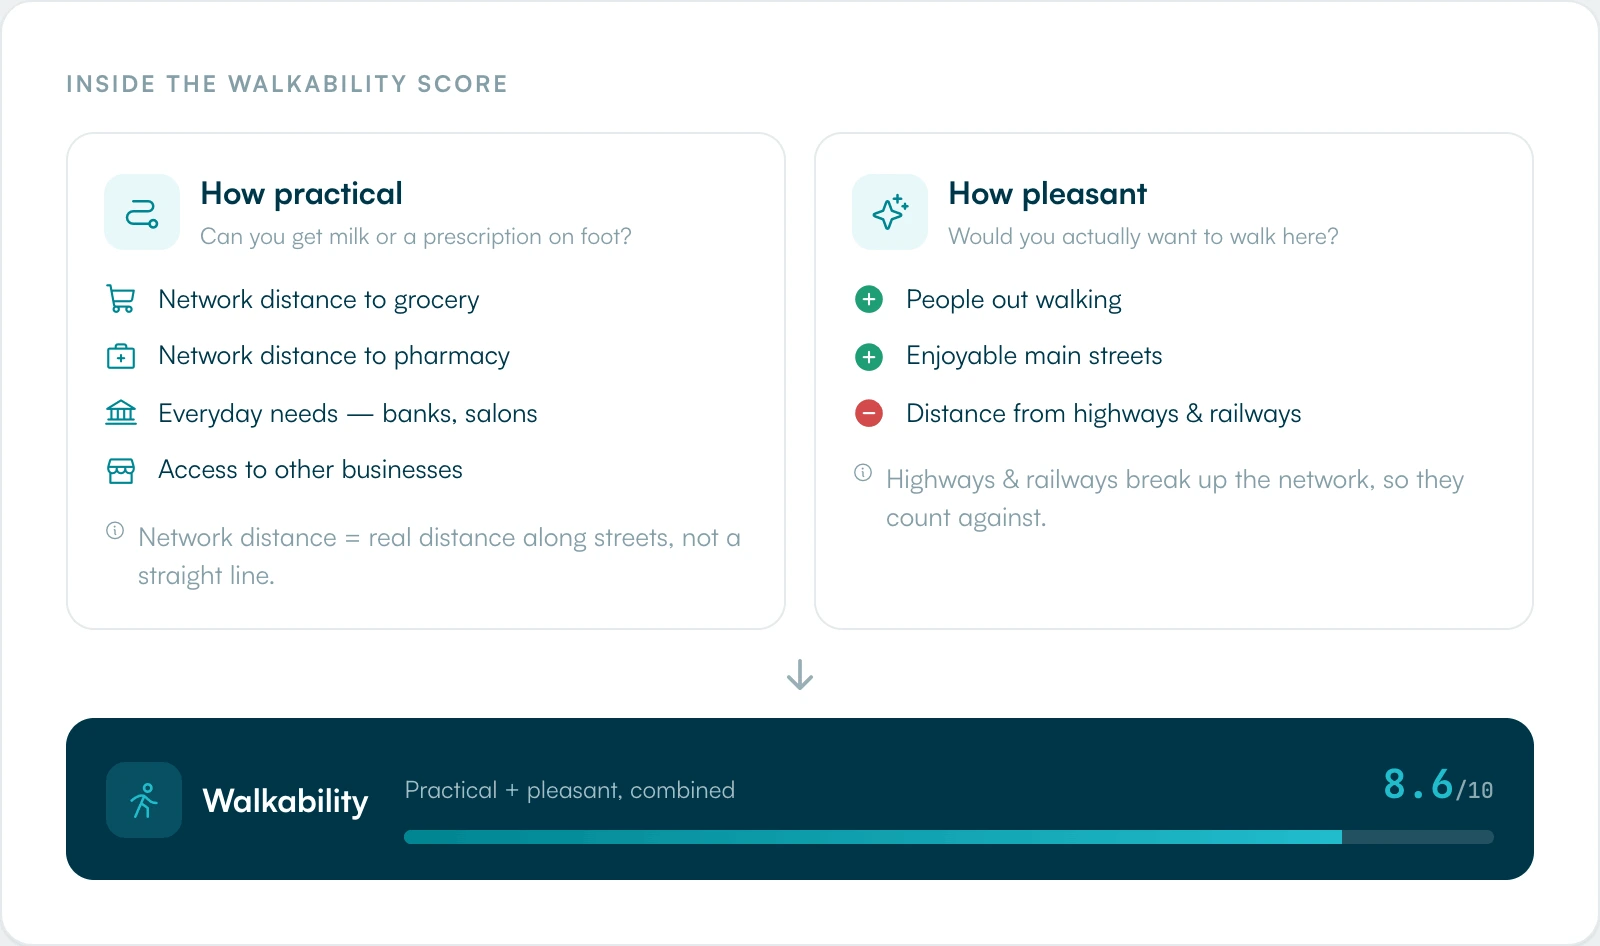
Built on two questions: how practical is it to meet daily needs on foot, and how pleasant is it to do so. Practicality starts from network distance, the real distance along the pedestrian network rather than a straight line, to the nearest grocery store and pharmacy, plus access to everyday businesses. That distinction matters: a grocery store five minutes away in a straight line is not really five minutes away if reaching it means crossing a highway or going through an underpass, and network distance captures the barriers that would actually keep someone from making the trip on foot. Pleasantness considers how many other people are likely to be out on foot, access to commercial streets that are enjoyable to walk through, and distance from highways and railways, which disrupt the pedestrian network and make the trip less pleasant.
Transit-friendly
Measures the level of public transit service at a point by looking at access to every nearby stop and station. Each one is weighted by the quality of the line it serves, how frequently service runs, and how many lines stop there, since more lines reach more places.
Quiet
Estimates how quiet a location is likely to be, based on proximity to noise sources such as traffic, airports, railways, and bars, and how far the noise from each source travels.
Greenery
Reflects trees and green space nearby, based on the number and size of street trees on the specific street analyzed and the acreage of city parks within reach.
Built to improve over time
The scores are not static. They start from thousands of input datasets and keep refining based on millions of pieces of feedback from people using the platform. The data flywheel means the scores get more accurate as more people interact with them.
Why the method matters
The way these scores are built is also why they hold up. They are objective and measured, not subjective opinions about an area. Walkability is computed from real network distances and proven experiential factors. Transit quality comes from line speed, frequency, and reliability. Quiet comes from measured proximity to noise sources. That gives a real estate company something specific to show buyers and something defensible to stand behind, instead of vague characterizations that carry Fair Housing risk. The rigor is the point: measured inputs, a transparent method, and a scale anyone can read.
Frequently asked questions
What scale are location scores on?
Each score runs from 0 to 10 and rates a single characteristic of a location, such as transit access or quietness. There is no single combined score, because people value different things in a place.
How does the access calculation work?
The model finds every relevant destination within a travel time of a point, adds up their value, and discounts each by distance. Value can be weighted by a destination’s quality, frequency, or size, so one excellent nearby option can score as well as several distant ones.
What is the difference between linear and gravity access?
Linear access discounts value in proportion to distance, so something twice as far is worth half. Gravity access discounts by distance squared, so something twice as far is worth a quarter. Linear spreads the effect out; gravity pinpoints where destinations are.
Are location scores calculated by neighborhood?
Local Logic scores are first calculated at a fine, address-level resolution, down to small geohash cells that can be smaller than a single street segment. Those granular scores can then be aggregated or summarized at the neighborhood level for products and reports that need a broader view. This approach captures differences that a neighborhood-only average would miss, while still supporting neighborhood-level analysis.
Does Local Logic have its own neighborhood data?
Yes. Local Logic sources, cleans, and maintains its own neighborhood boundaries to support neighborhood-level insights, reports, and consumer experiences. That boundary work helps ensure neighborhoods are represented consistently and can be connected to location scores, points of interest, addresses, and other spatial data.