


How Are Neighborhood Boundaries Defined?
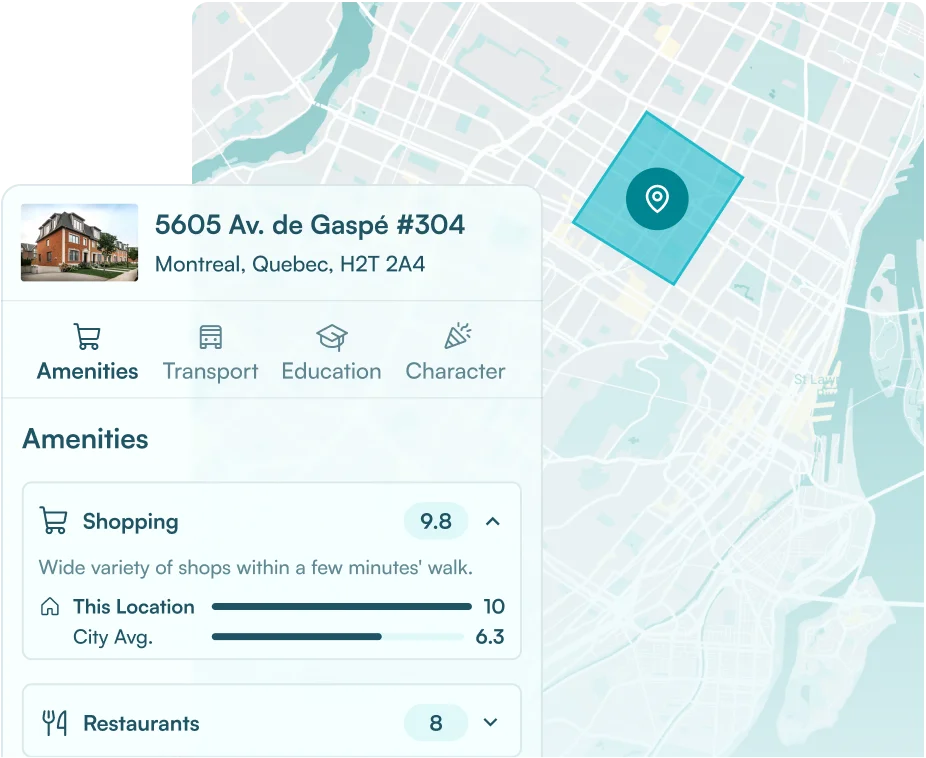
Most neighborhoods do not have official, government-issued boundaries the way cities or counties do; they are often social constructs. So defining them takes deliberate work. Local Logic builds a hierarchy of geographies, from the street up through neighborhoods, boroughs, municipalities, counties, and metro areas, drawing on municipal open data and national statistics agencies. It then cleans those boundaries to fix gaps, awkward names, and lines that cut through buildings, so each neighborhood reflects how people actually recognize the area.
Why defining a neighborhood is hard
Ask ten people where one neighborhood ends and the next begins, and you will get ten slightly different answers. Cities, counties, and ZIP codes have official boundaries. Neighborhoods usually do not. They live in how people talk about a place, which makes them meaningful to buyers and genuinely difficult to map.
Census boundaries do not solve this. They are designed for counting people, not for describing how a city is lived in, so they often group together areas that feel nothing alike and split areas that locals consider one place. To describe neighborhoods the way home consumers think about them, you have to define the boundaries deliberately, then keep them accurate.
It starts below the neighborhood
Local Logic’s underlying data is computed at a very fine grain, down to small geohash cells (a fine grid of location squares) that can be smaller than a single street segment. That is the resolution at which location scores are calculated, because it captures how different one block, or even one side of a block, can be from the next. Boundaries work the other way around: they are the named areas that those fine-grained signals roll up into, the neighborhoods, boroughs, and cities people actually search for.
The hierarchy of geographies
Local Logic organizes places into a hierarchy, from the smallest recognizable area up to the country. Each level answers a different question that a home consumer or a real estate company might ask.
| Geography | What it is | Coverage |
|---|---|---|
| Neighborhood | The smallest named area people recognize | Partial (US and Canada) |
| Borough / macro-neighborhood | A larger district within a city, or a former municipality | Limited (US and Canada) |
| Municipality | A city, town, or village | Full in Canada, partial in the US |
| ZIP code | US postal geography | Full (US) |
| County / county subdivision | County and census-division geographies | Full (US and Canada) |
| Metro area | CMA in Canada, MSA in the US | Partial (US and Canada) |
| Province / state, country | The largest administrative areas | Full (US and Canada) |
An honest consequence of this is worth stating plainly: Local Logic can always tell you which municipality or county a coordinate falls into, because those have full coverage. Naming the neighborhood is different. Neighborhoods are mapped wherever they are recognized as distinct places, rather than carpeting every corner of the country, so a coordinate can occasionally fall outside a defined neighborhood. Being clear about coverage is part of being trustworthy with the data.
Neighborhoods do not nest neatly
It is tempting to assume these levels stack like nested boxes, with every neighborhood sitting inside a borough inside a city. Real cities are messier. Take Montreal, our hometown. The city proper excludes separate municipalities, like Westmount and Pointe-Claire, that sit inside the wider metro area. Some neighborhoods do not belong to any borough at all. The neighborhoods that exist do not always add up to cover the whole city.
This is why defining boundaries is more than downloading a file. Overlapping and non-nesting geographies are the normal case, not the exception, and handling them consistently is part of the work.
Where the boundaries come from
Local Logic draws boundaries from authoritative sources and fills the gaps where those sources stop:
- Neighborhoods and boroughs: municipal open data portals in Canada, gathered from over a hundred sources, and partner data in the US.
- Municipalities, counties, metros, provinces and states: Statistics Canada and the US Census Bureau.
Government data is the foundation, but it is rarely clean enough to use as is. That is where the real work begins.
How Local Logic cleans the boundaries
Raw open data boundaries come with recurring problems. Local Logic corrects each one so the final boundaries are accurate, complete, and recognizable to the people who live there:
- Incomplete coverage. When the source boundaries leave gaps in a city, new polygons are drawn to fill them.
- Awkward names. Official names are sometimes a mouthful or simply not what locals use. Names are adjusted to what residents actually call the area.
- Insufficient granularity. When a single polygon is too large and hides smaller, distinct neighborhoods, it is broken up or redrawn.
- Poorly drawn polygons. Small gaps and overlaps between adjacent neighborhoods are removed so borders line up.
- Illogical boundaries. Lines that cut through houses are redrawn to follow natural dividers like streets, rivers, and property lines.
- Misalignment across levels. When neighborhood and municipal boundaries from different sources do not line up, they are reconciled so they display cleanly together on a map.
Getting demographics right on custom boundaries
Once a neighborhood boundary exists, attaching accurate data to it is its own challenge, because a neighborhood rarely matches the census boundaries the data was collected on. Spreading population evenly across an area overstates the empty parts, like parkland or industrial zones, and understates where people actually cluster. Local Logic estimates neighborhood demographics by weighting toward where people actually live rather than by raw land area, and defers to official census figures where a neighborhood lines up closely with a census boundary. The result is neighborhood-level data that stays faithful to authoritative sources.
Why the method matters
Boundaries are invisible when they are right and obvious when they are wrong. A neighborhood page that uses a name no one recognizes, or scores a half-empty industrial tract as if it were residential, loses a buyer’s trust immediately. Careful, cleaned, consistent boundaries are what make everything built on top of them, the scores, the profiles, the market stats, accurate and defensible. It is the unglamorous foundation that makes the rest legible.
Frequently asked questions
Do neighborhoods have official boundaries?
Generally no. Unlike cities, counties, or ZIP codes, neighborhoods usually have no official, government-issued boundaries. They reflect how people recognize an area, which is why defining them consistently takes deliberate work.
How are neighborhood boundaries different from census boundaries?
Census boundaries are built for counting population, not for describing how a city is lived in. They often combine areas that feel different or split areas locals see as one place. Neighborhood boundaries aim to match how people actually think about and name an area.
Where does Local Logic get its boundary data?
From authoritative sources: municipal open data portals for neighborhoods and boroughs, and national agencies (Statistics Canada and the US Census Bureau) for municipalities, counties, metros, and states. Local Logic then cleans and completes that data.
Can Local Logic identify the neighborhood for any address?
Not everywhere. Municipalities and counties have full coverage, so those can always be identified. Neighborhood coverage is concentrated in major cities, so some addresses fall outside a defined neighborhood boundary.