


How Are Walkability, Transit, Cycling, Quietness, and Vibrancy Measured?
Each of these is a separate 0 to 10 score that rates one way of living in a place. Walkability measures how practical and pleasant it is to meet daily needs on foot. Transit measures the level of public transit service. Cycling measures how good a location is for biking, for both getting around and recreation. Quiet estimates how quiet a location is likely to be, based on nearby noise sources. Vibrancy measures how much human activity surrounds a location. Most are built on the same access model: find what is relevant nearby, and weight each by how far away it is.
One model underneath, many scores on top
Before the individual scores, the shared idea. Most Location Scores are built on access: the model finds every relevant thing within a travel time of a point, adds up its value, and discounts each by distance, so being close to one good option can score as well as being far from several. Scores are computed at a fine, address-level resolution, down to small geohash cells that can be smaller than a single street segment, which is why two points on the same block can score differently. What changes from score to score is the inputs and how each is weighted. The rest of this page walks through five of them.
Walkability (the pedestrian-friendly score)
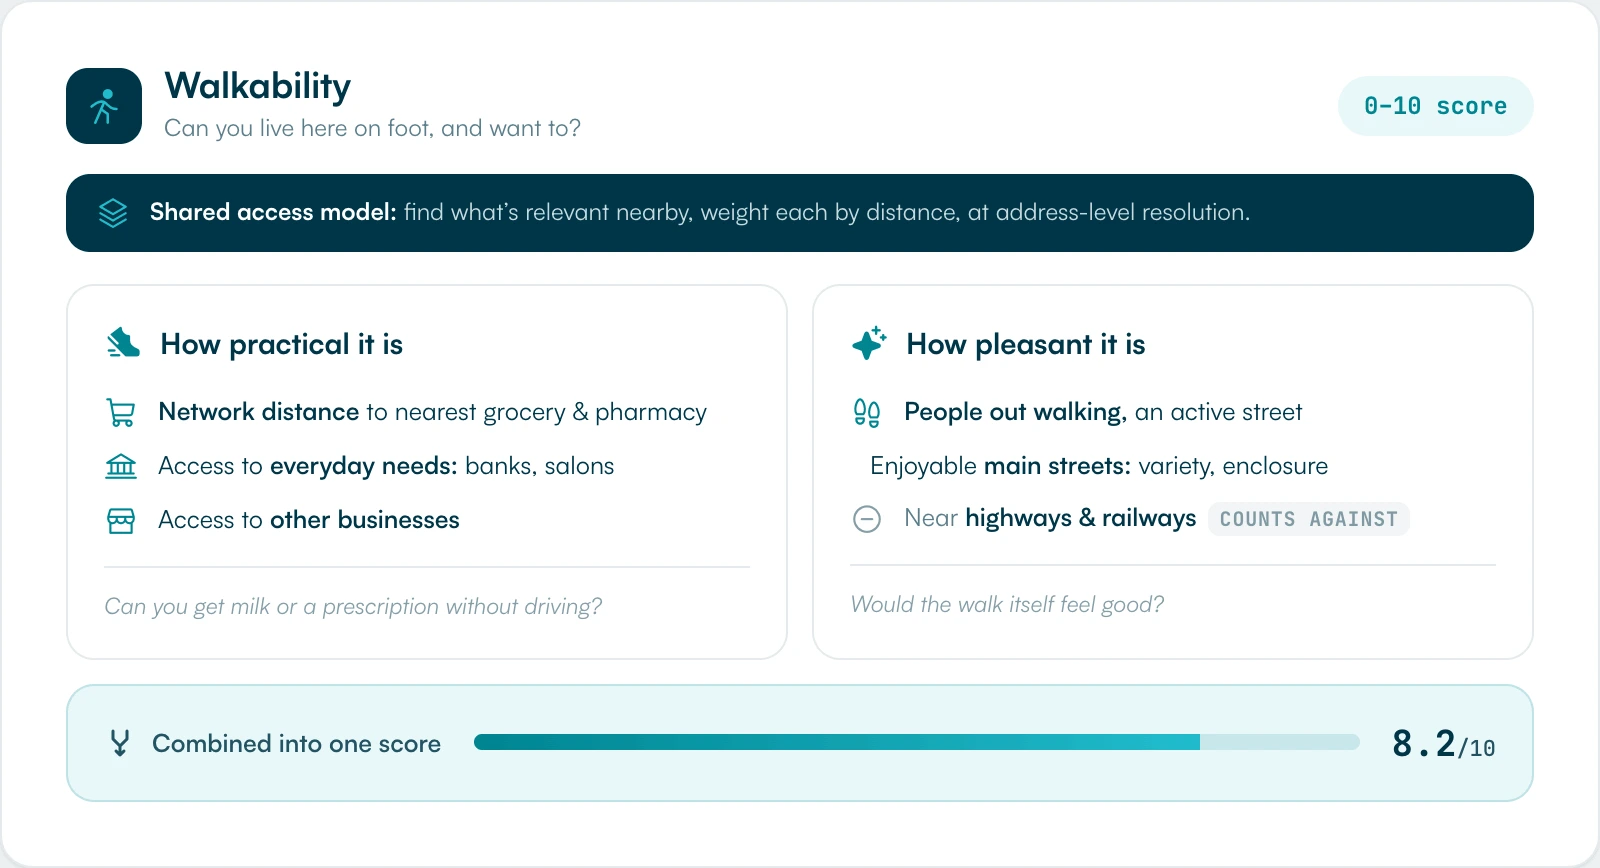
Walkability answers a simple question: can you actually live here on foot, and would you want to? Local Logic splits that into two parts.
The first is how practical walking is. That comes from the network distance (the real distance along streets and pedestrian paths, not a straight line) to the nearest grocery store and pharmacy, plus access to everyday needs like banks and hair salons, and access to other kinds of businesses. In short, can you get a carton of milk or a prescription without driving?
The second is how pleasant walking is. That comes from how many other people are likely to be out walking, which makes a street feel more active and interesting, access to main streets that are enjoyable to walk along (judged on things like the variety of businesses and the sense of enclosure the building fronts create), and distance from highways and railways, which break up the walking network and make the experience worse, so their presence counts against the score.
Transit (the transit-friendly score)
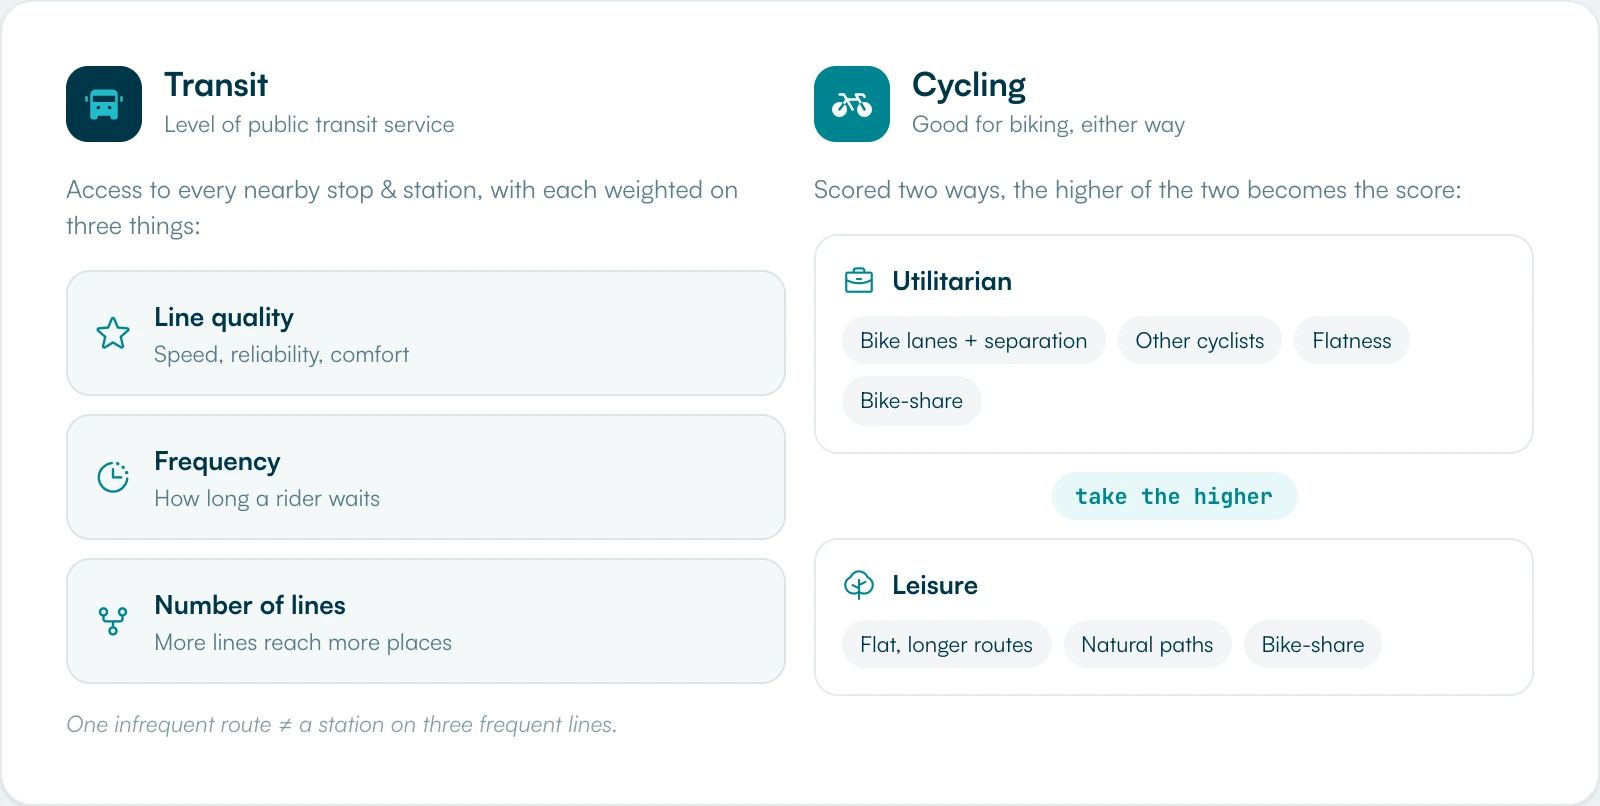
Transit measures the level of public transit service at a location. It works by looking at access to every nearby stop and station, then weighting each one on three things:
- The quality of the line it serves, judged on attributes like speed, reliability, and comfort.
- The frequency of service, which determines how long a rider waits.
- The number of lines that serve it, since more lines reach more places.
A bus stop served by one infrequent route is not the same as a station on three frequent lines, and the score reflects that difference rather than just counting stops.
Cycling (the cycling-friendly score)
People bike for two different reasons, so cycling is scored two ways and the higher of the two becomes the final score.
The utilitarian view asks how easy it is to bike for practical trips. It looks at the length of nearby cycling infrastructure like bike lanes, weighted by how well that infrastructure separates riders from car traffic, the number of other cyclists around (more riders tends to make cycling more comfortable, as drivers grow accustomed to them), how flat the area is, and, in cities with bike-share systems like Bixi or CitiBike, access to nearby stations.
The leisure view asks whether there are pleasant places to ride for exercise or enjoyment, scoring higher for flat, longer routes and paths in natural settings, along with overall flatness and bike-share access where it exists. Taking the higher of the two means a location is credited for being good at either kind of cycling.
Quiet (the quiet score)
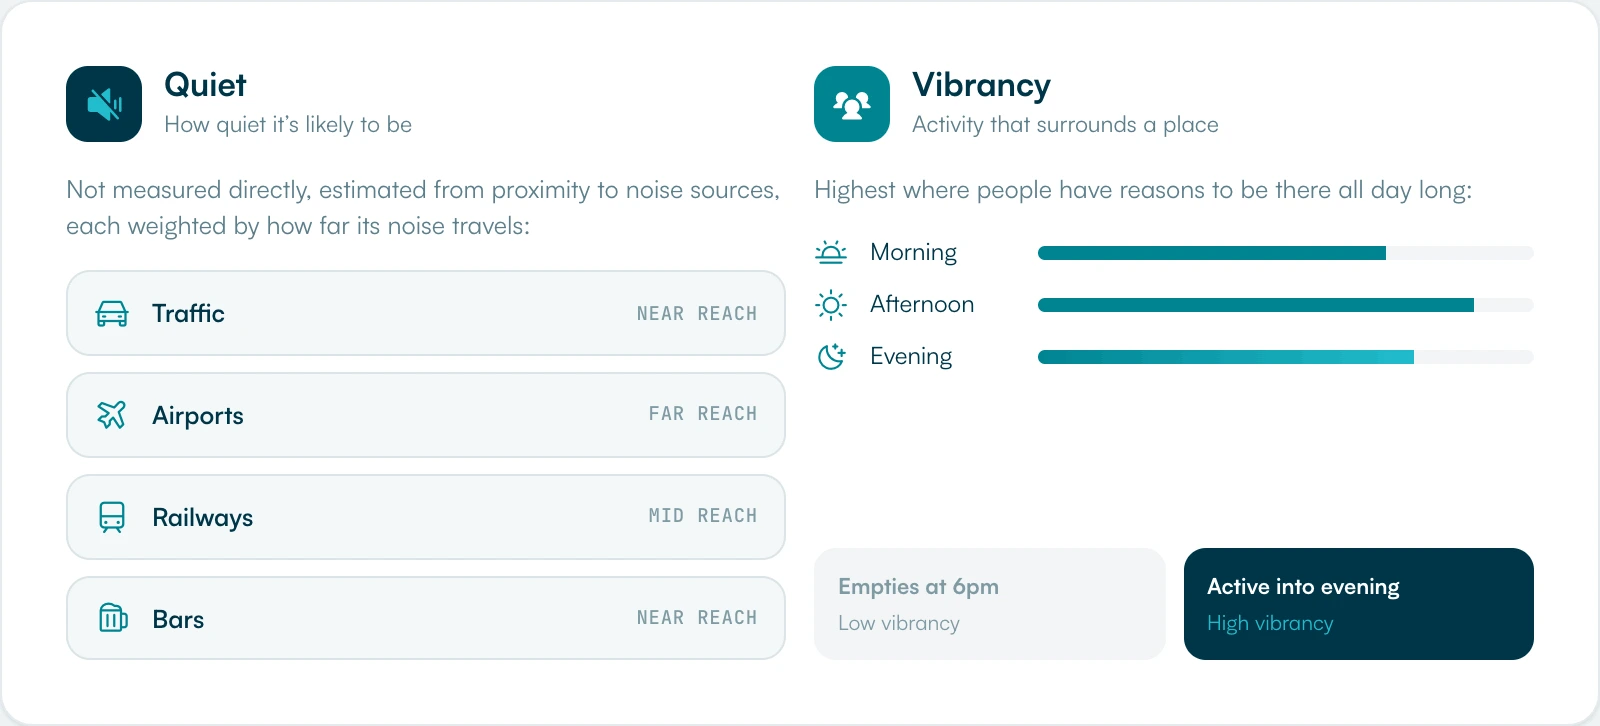
Quiet estimates how quiet a location is likely to be. Instead of measuring sound directly, it looks at proximity to noise sources such as traffic, airports, railways, and bars, and for each source, it accounts for how far that noise tends to travel. A home a block from a rail line and a home deep in a residential pocket are treated differently because the things that generate noise are in different places.
Vibrancy (the vibrant score)
Vibrancy measures how much human activity surrounds a location, the feeling of being where things are happening. The locations that score highest are the ones that give people a variety of reasons to be there throughout the day, whether for work, errands, eating out, or simply living there. It is the difference between a street that empties at 6pm and one that stays active into the evening.
Why measure it this way
These scores exist to turn something people feel into something they can compare. A buyer cannot easily judge whether one street is more walkable than another two neighborhoods over, but a score can. And because every score is built from measured inputs, network distances, transit frequency, the location of noise sources, rather than someone’s impression of an area, the result is objective and defensible. That matters for trust, and it keeps neighborhood descriptions grounded in specific attributes rather than vague characterizations.
Frequently asked questions
How is a walkability score calculated?
It combines how practical walking is (network distance to a grocery store and pharmacy, plus access to everyday businesses) with how pleasant it is (how active the street is, access to enjoyable main streets, and distance from highways and railways). The two come together into a single 0 to 10 score.
What makes a good transit score?
Access to nearby stops and stations, weighted by the quality of the lines they serve, how frequently service runs, and how many lines stop there. Frequent, high-quality service on multiple lines scores higher than a single infrequent route.
Why is cycling scored two different ways?
Because people bike for practical trips and for recreation, and a location can be good at one without the other. Local Logic scores both the utilitarian and leisure perspectives and uses the higher of the two as the final cycling score.
How is the quiet score measured if sound is not recorded?
It estimates likely quiet from proximity to noise sources such as traffic, airports, railways, and bars, accounting for how far noise from each source travels, rather than from direct sound measurement.