


How Are Points of Interest Collected and Classified?
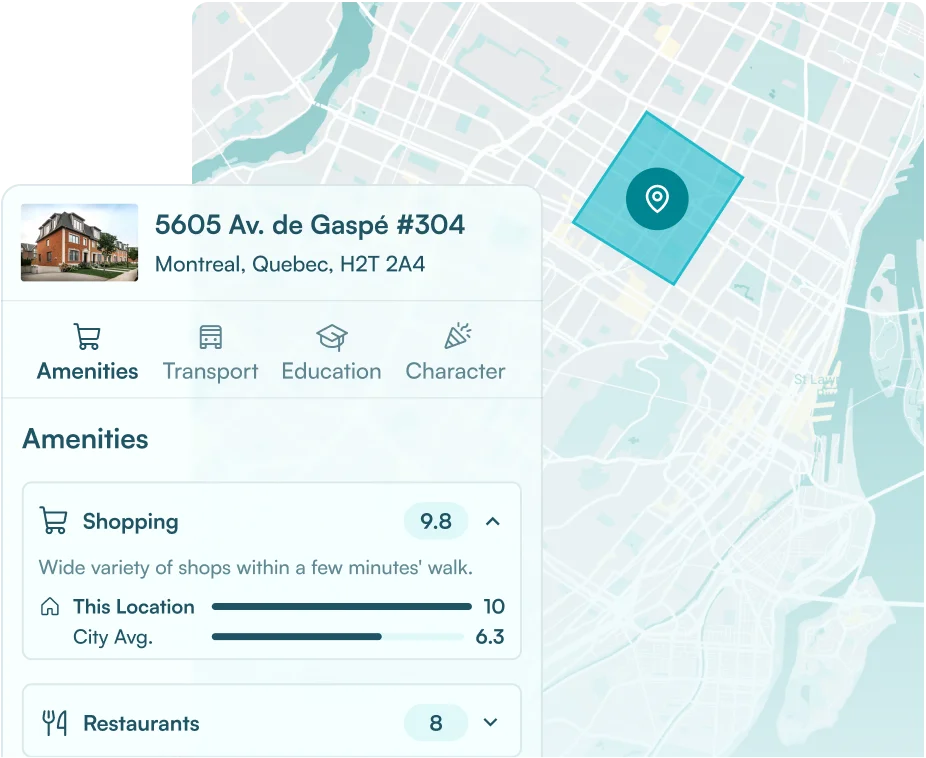
Points of interest (POIs) are the places that shape daily life around an address: groceries, restaurants, cafes, transit stops, parks, and more. Local Logic gathers them from a blend of open, partner, and proprietary sources across the US and Canada, then organizes every place into a consistent set of categories and adds brand and tag labels for finer detail. Those classified POIs do two jobs: they answer what is nearby and are the underlying signal behind several Location Scores.
What a point of interest is
A point of interest is any place that shapes daily life around a home. The grocery store you would actually walk to. The cafe on the corner. The transit stop, the park, the pharmacy. POIs are the answer to the question every home consumer asks after they like a property: what is around here?
On their own, a pile of business listings is not very useful. The value comes from collecting them comprehensively, organizing them so they can be compared and filtered, and connecting them to how people actually evaluate a place. That is the work behind the data.
How POIs are collected
Local Logic’s data foundation spans more than 250 million addresses across the US and Canada, built on over 100 billion location data points drawn from public, proprietary, and partner sources. POIs are part of that foundation. Rather than relying on a single feed, Local Logic blends multiple sources so coverage stays broad and current across both countries, then normalizes everything into one consistent structure. That normalization is what lets a coffee shop in Denver and a coffee shop in Montreal be treated the same way, so the data behaves predictably wherever a buyer is looking.

How POIs are classified
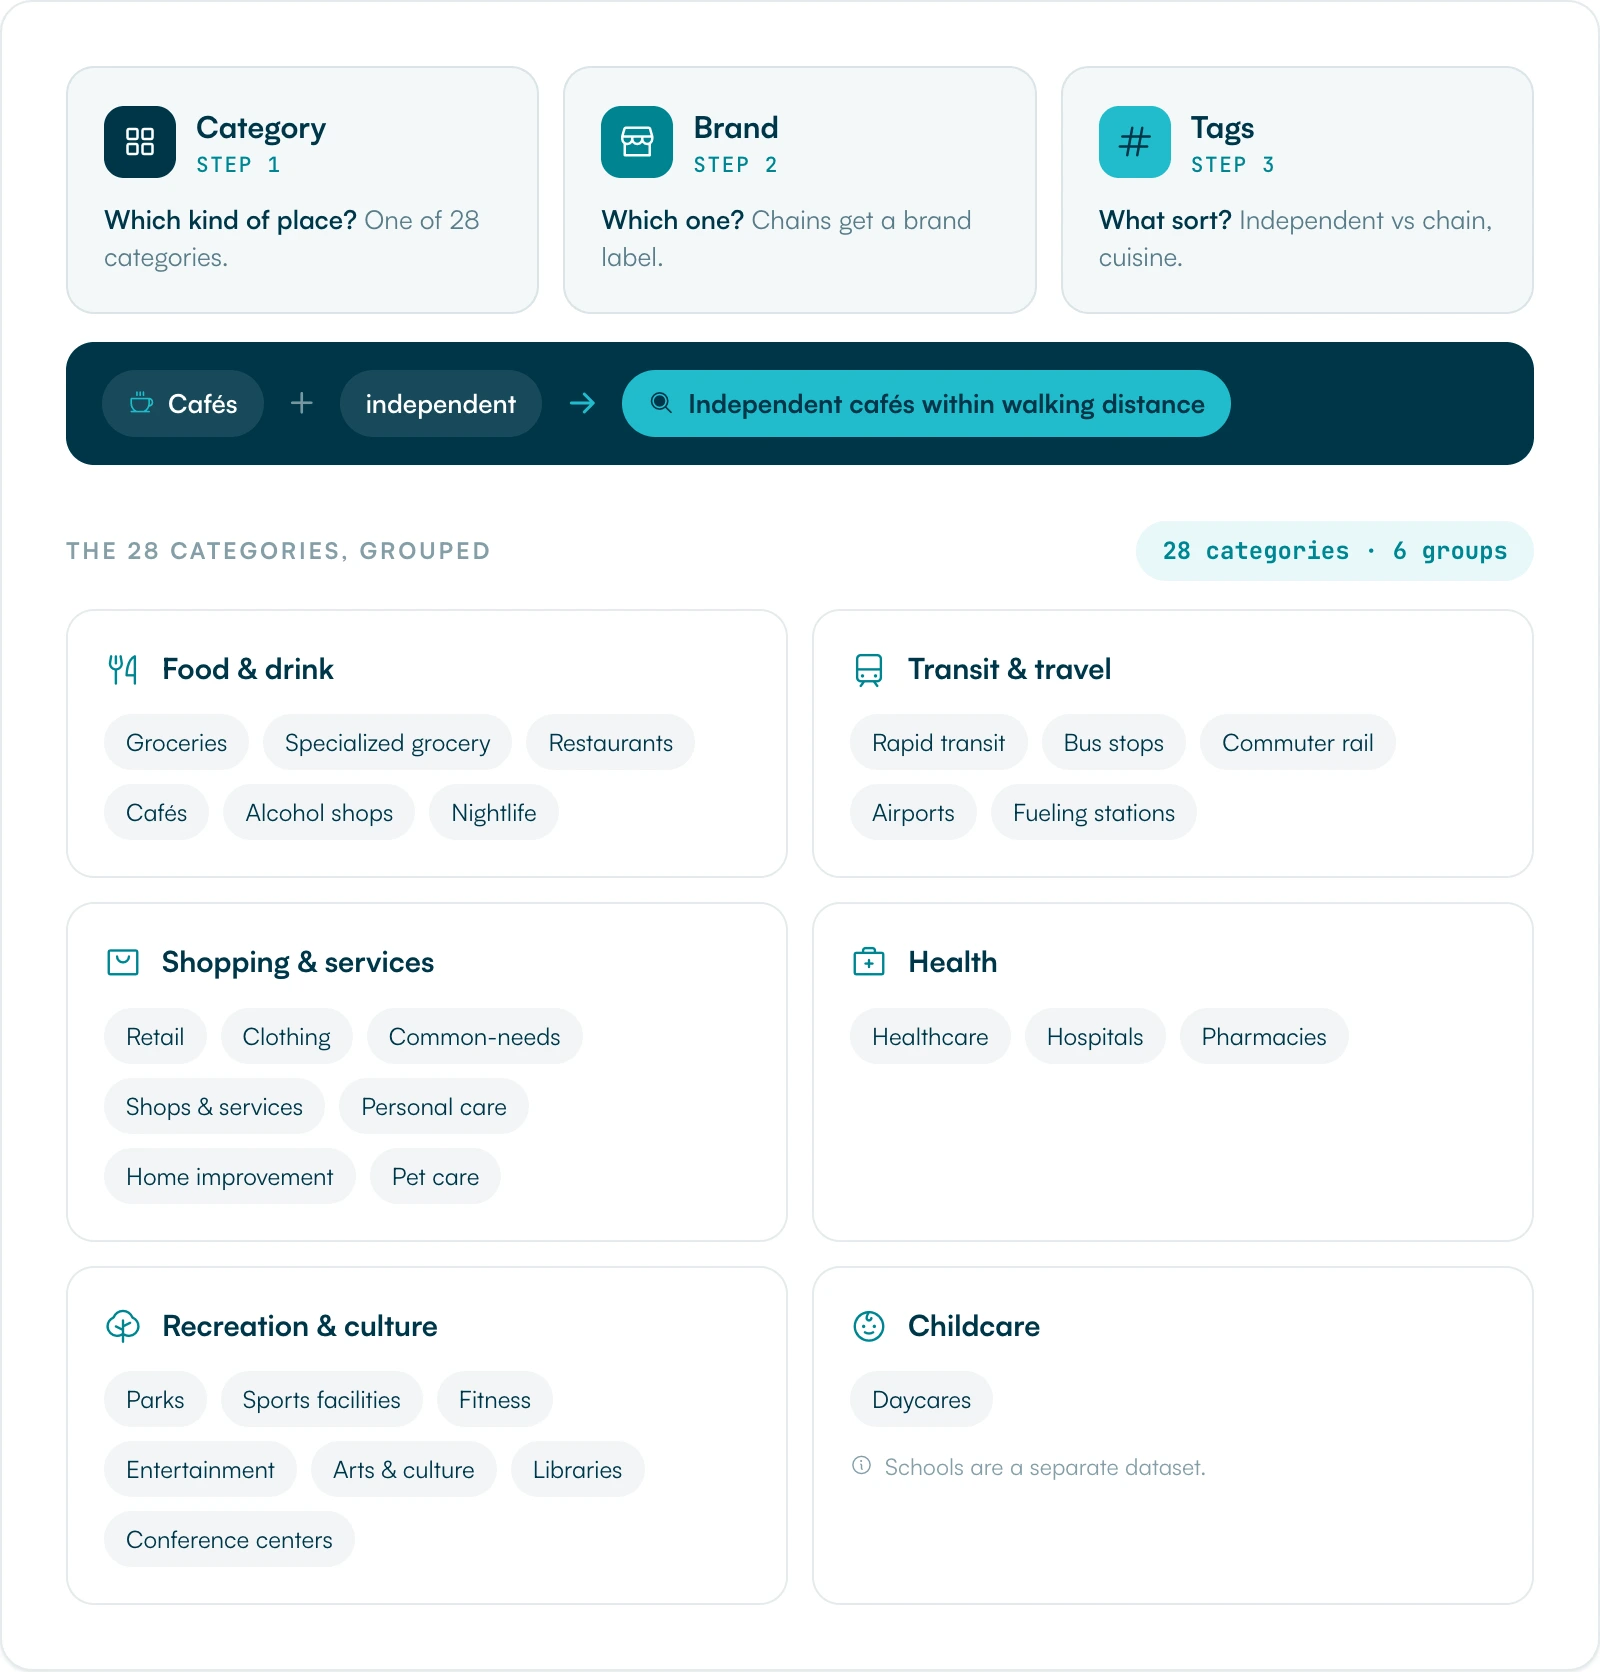
Every POI is sorted into a category, then labeled with brands and tags for finer detail. That three-part structure is what makes the data filterable and genuinely useful rather than a flat list.
Categories
Local Logic organizes POIs into 41 categories covering the full range of daily needs. Grouped for readability, they look like this:
| Group | Categories |
|---|---|
| Food and drink | Groceries, specialized groceries, supermarkets, convenience stores, food shops, restaurants, cafes, alcohol shops, nightlife |
| Transit and travel | Rapid transit stations, subway and separated rail stations, bus stops, tram stops, commuter train stations, ferry terminals, cable car stations, funicular stations, airports, car fueling stations |
| Shopping and services | Retail, department stores, clothing shops, non-food shops, common-needs shops, shops and services, personal care, home improvement, pet care, banks |
| Health | Healthcare, hospitals, pharmacies |
| Recreation and culture | Parks, sports facilities, fitness, entertainment, arts/culture/science, libraries, conference centers, casinos |
| Childcare | Daycares (schools are maintained as a separate dataset, covered below) |
The category set grows over time as new kinds of places become worth distinguishing, so the current list is best treated as the live set rather than a fixed number.
Brands and tags
Categories answer what kind of place this is. Brands and tags answer which one and what sort. Brand labels identify chain businesses, so a site can surface or filter by a specific brand. Tags capture finer distinctions, such as whether a business is independent or a chain, or the cuisine type of a restaurant. Together they let a website show, for example, independent cafes within walking distance rather than every coffee shop in the area.
How classified POIs power Location Scores
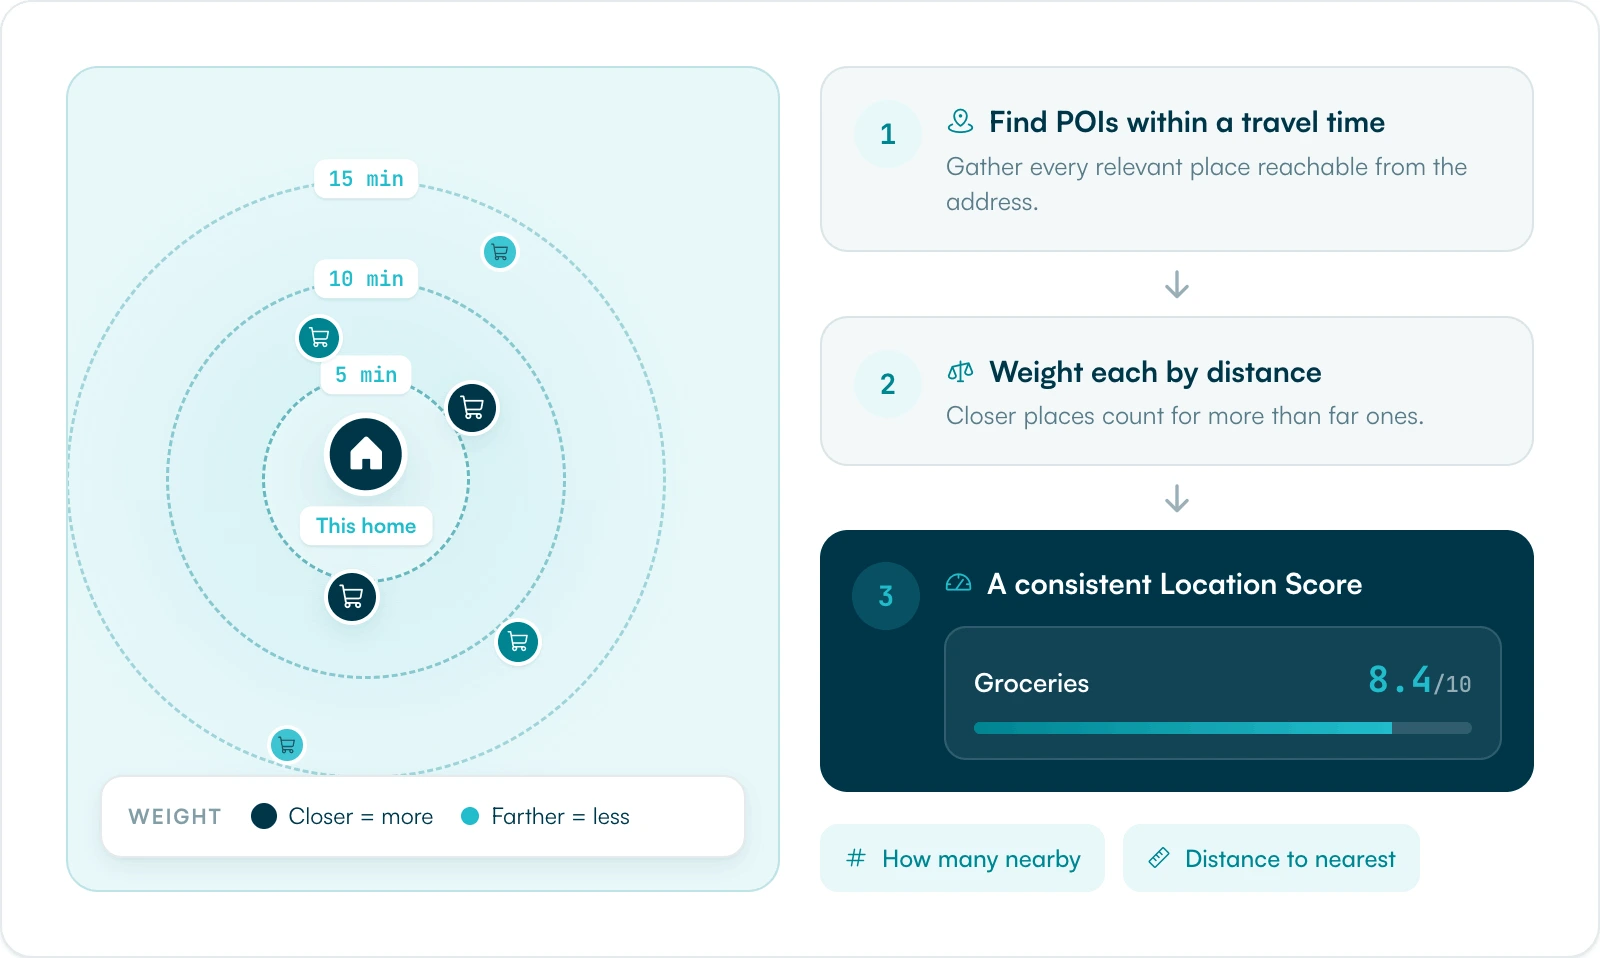
POIs are not just for map pins. They are the raw signal behind several Location Scores. When Local Logic measures access to groceries, restaurants, or transit, it is measuring access to the relevant POIs: finding every one within a travel time and weighting each by distance. Because the POIs are categorized consistently, the scores built on them are consistent too. Clean inputs are what make a walkability or transit score mean the same thing in every market.
Querying POIs: around a point or within an area
POIs can be retrieved two ways: around a coordinate, using a location and a radius, or within a defined geography like a neighborhood. Results come back with their category, brand, and tag labels, so a product team can filter to exactly what matters for a given experience, whether that is a listing page showing nearby amenities or a neighborhood page summarizing what an area offers.
Beyond the raw list of places, you can also get derived metrics on them, such as how many of a category are nearby and how far the closest ones are. That is often the insight people actually want: not every cafe in the area, but how many cafes are within a short distance, or the distance to the nearest grocery store. This is what makes proximity analysis, the what-is-within-reach question, straightforward to build.
Schools: a dedicated dataset
Schools sit in their own dataset rather than among general POIs, with separate coverage for the US and Canada because the two countries publish school information differently. The goal is to answer one practical question at the level of a single address: what are the school options here?
The dataset includes primary and high schools with details like names, websites, educational levels, grade ranges, languages of instruction, and special programs, along with school board information. It also includes proximity metrics, distance and walking time, and catchment-area boundaries, so a site can show which schools serve a given address. School search works by coordinate and radius (a default of five kilometres, extendable to twenty-five) or against custom boundaries.
Local Logic can display school rating data for individual schools where that data is available from approved sources. These ratings may appear alongside other school details, such as name, grade range, language of instruction, programs, distance, walking time, and catchment information. The ratings are sourced from external datasets and are presented as informational attributes about specific schools, not as Local Logic’s own evaluation or endorsement.
One distinction is worth being precise about: when school rating data is displayed, it describes an individual school, not a neighborhood. Local Logic does not grade neighborhoods by school quality, does not use schools as a proxy for the character of an area, and does not independently rank or evaluate schools. It presents sourced facts about specific schools and lets home consumers draw their own conclusions.
Why the method matters
Good POI data is invisible when it works and glaring when it does not. Show a buyer a grocery store that closed two years ago, or miss the park across the street, and the whole experience loses credibility. Comprehensive collection, consistent categories, and accurate brand and tag labels are what make the rest of the platform trustworthy: the scores, the neighborhood profiles, the proximity analysis on a listing page. It is also objective by design. POIs describe what is actually there and how far away it is, measured facts that a real estate company can stand behind.
Frequently asked questions
What is a point of interest in real estate data?
A point of interest is a place that shapes daily life near a home: groceries, restaurants, cafes, transit stops, parks, pharmacies, and more. In real estate, POIs answer what is nearby and feed location scores like walkability and transit access.
How are POIs categorized?
Local Logic sorts every POI into one of 41 categories, then adds brand labels for chains and tags for finer distinctions like independent versus chain or cuisine type. That structure makes the data filterable and consistent across markets.
Where does POI data come from?
From a blend of open, partner, and proprietary sources across the US and Canada, normalized into one consistent structure so places are classified the same way wherever they are.
Is school data the same as POI data?
No. Schools are maintained as a separate dataset, with distinct US and Canada coverage, because school information is published differently in each country. It includes school details, proximity, and catchment boundaries to answer what the school options are at a specific address.
Does Local Logic rate schools?
No. Local Logic does not independently rate, rank, or evaluate schools. Where available and enabled, Local Logic can display school rating data from approved external sources alongside factual school information such as grade range, language of instruction, programs, distance, walking time, and catchment boundaries. These ratings describe individual schools, not neighborhoods.